SERIES: PART 10
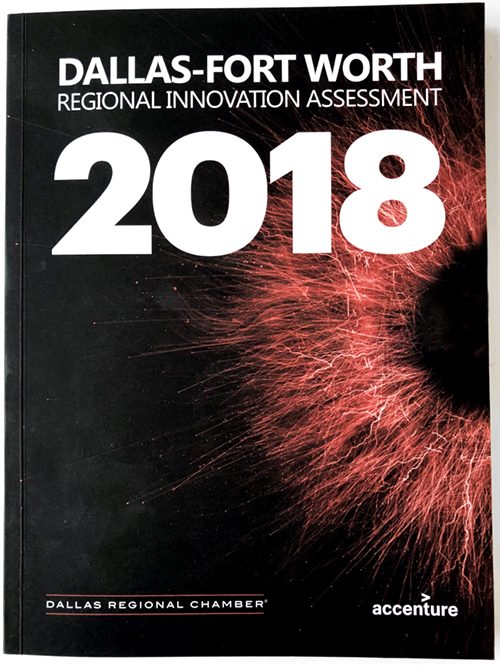
The Dallas-Fort Worth Regional Innovation Assessment 2018
DFW Innovation Economy is a serial look at chapters from the 2018 Innovation Assessment produced by the Dallas Regional Chamber (DRC) and Accenture. Each chapter of the Assessment comprises key metrics that can be tracked over time to evaluate the strength of Dallas-Fort Worth’s innovation economy in relation to competitor metropolitan areas. Measures related to patent production, venture capital flows, educational attainment, business climate and various metropolitan rankings help to paint a picture of innovation-driven economic growth potential of DFW.
This appendix shares some of the metrics behind each chapter. For the complete series on how DFW stacks up as a global hub for innovation, go here.
Table 1: Population Growth, 2010-2017
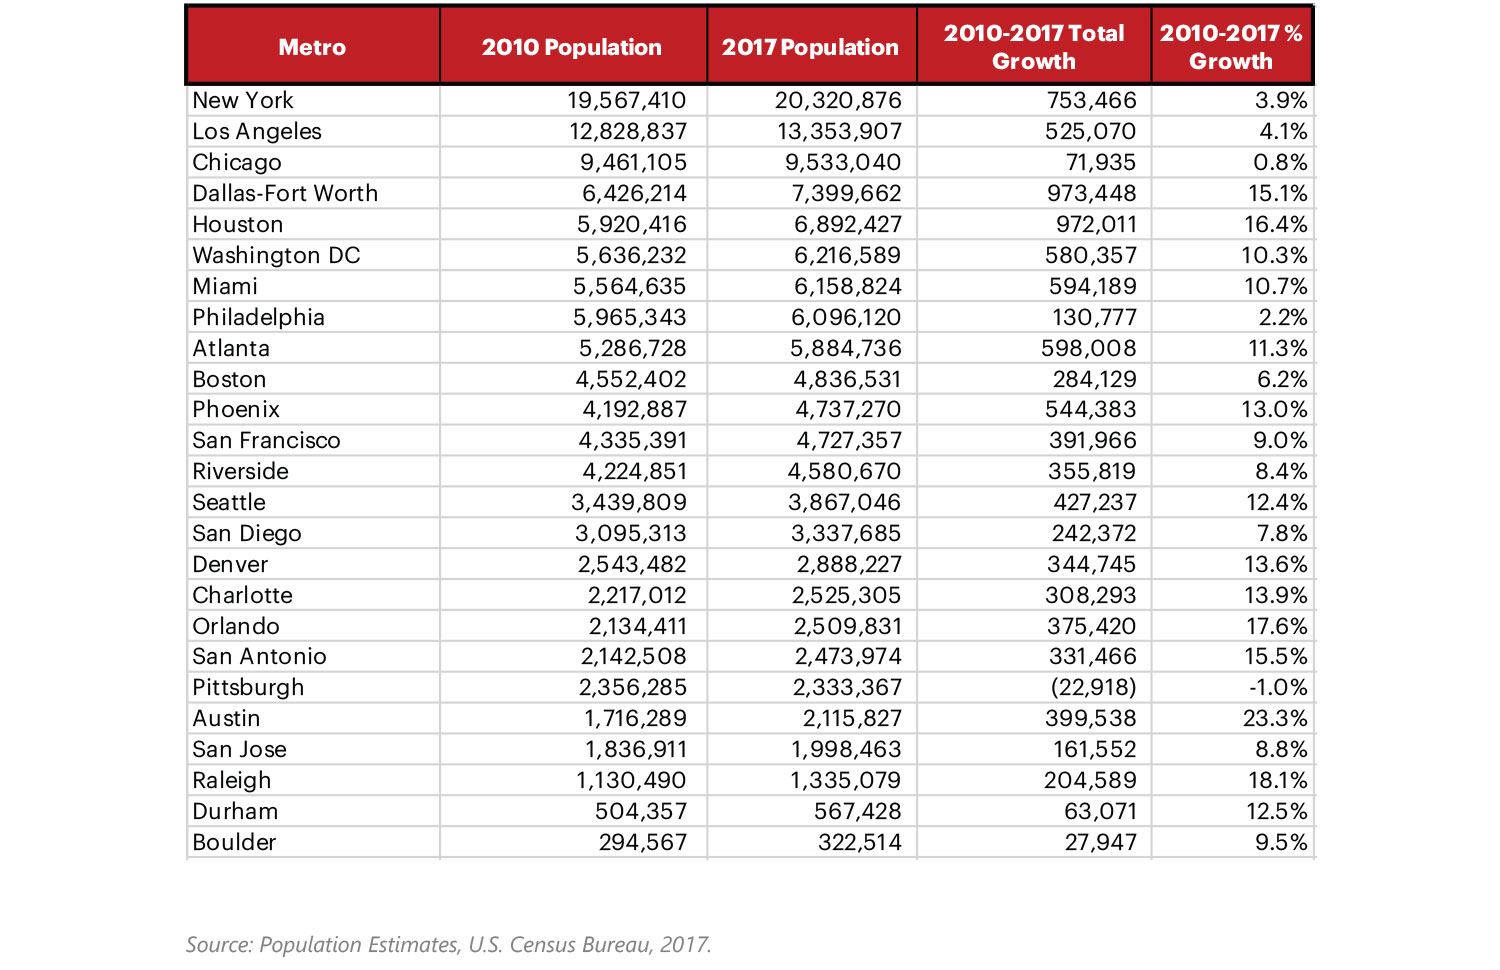
Table 2: Components of Population Change, 2010-2017
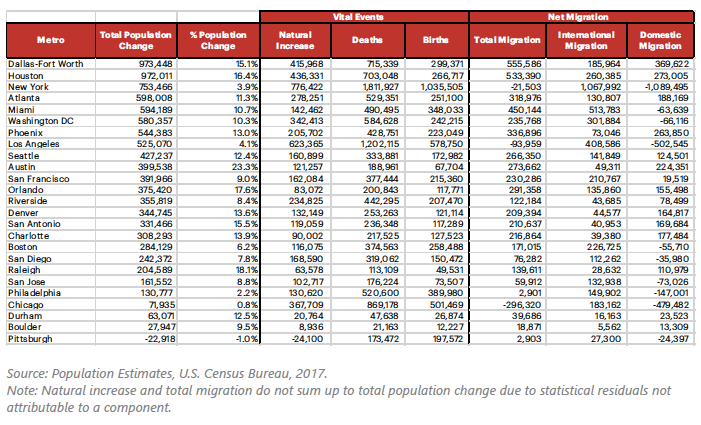
Table 3: Brain Gain or Drain in Tech Fields, 2012-2016
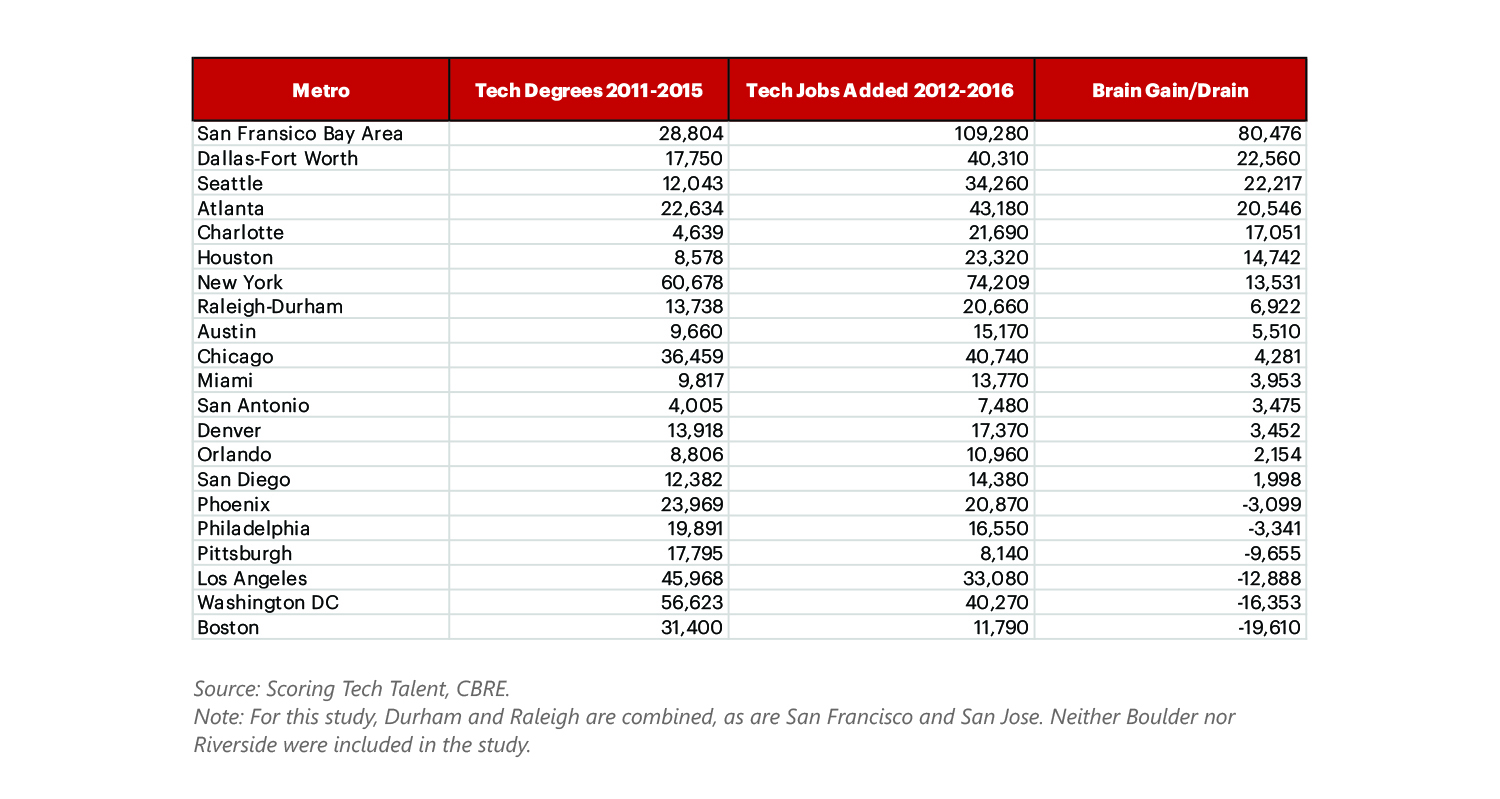
Table 4: Total Establishment Births and Deaths by Size of Business, 2014-2015
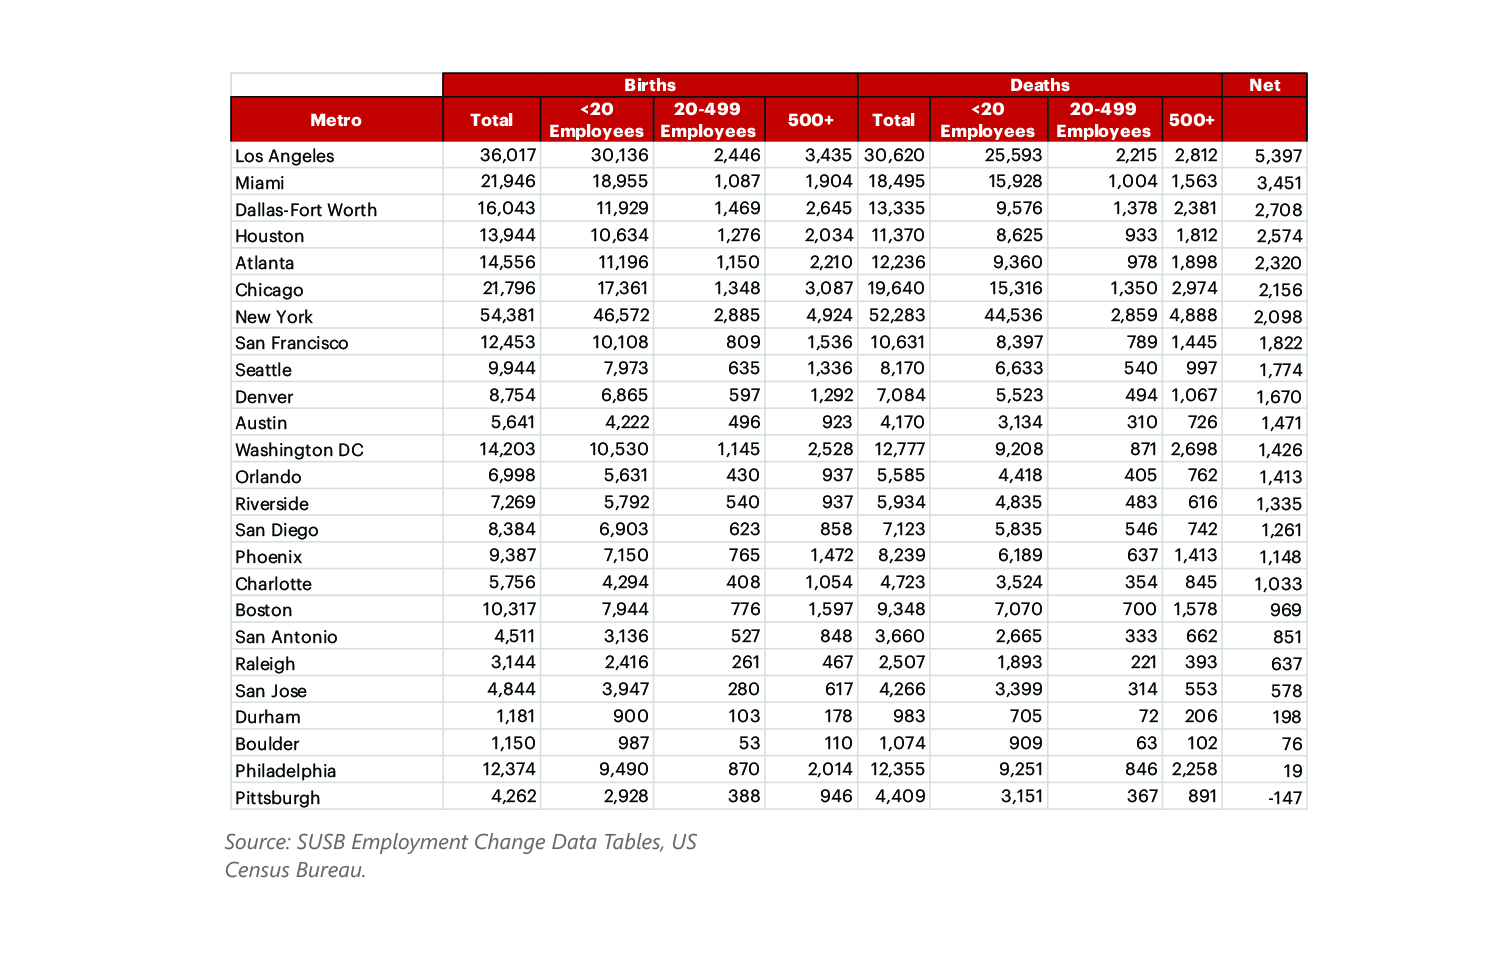
Table 5: Rate of New Entrepreneurs Per 100,000 Adult Population, 2010-2016
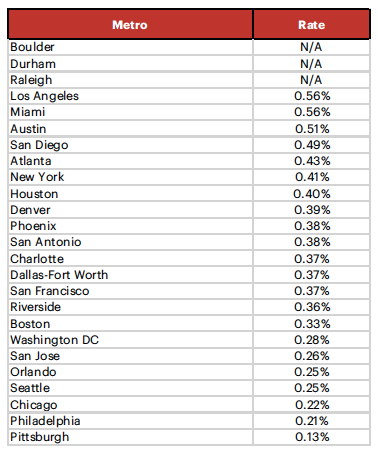
Source: Kauffman Foundation
Early and broad measure of business ownership. Measures the percent of the adult population of an area that became entrepreneurs in a given month.
Table 6: Opportunity Share of New Entrepreneurs, 2010-2016
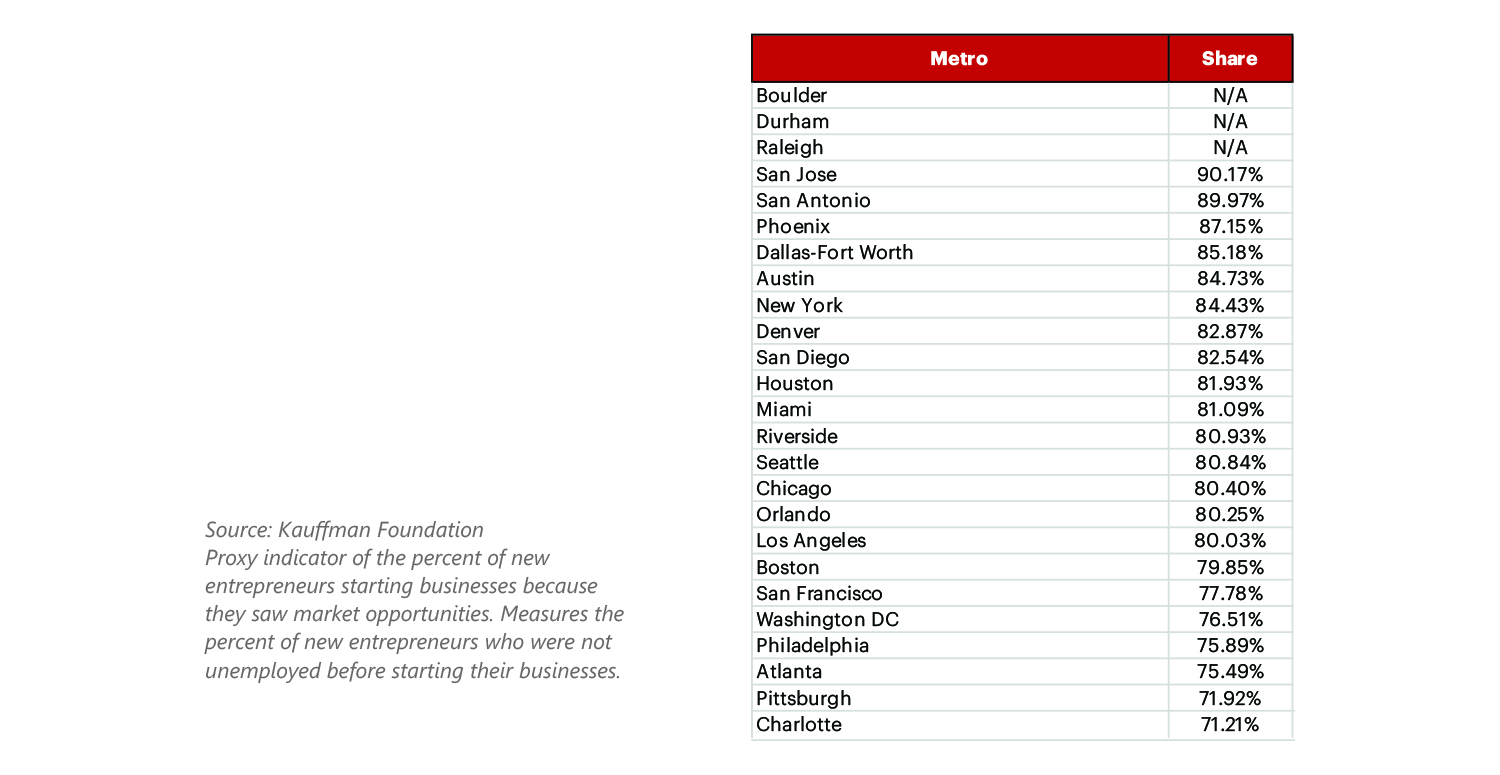
Table 7: Total and Per Capita R&D Expenditures at Universities and Colleges, 2016
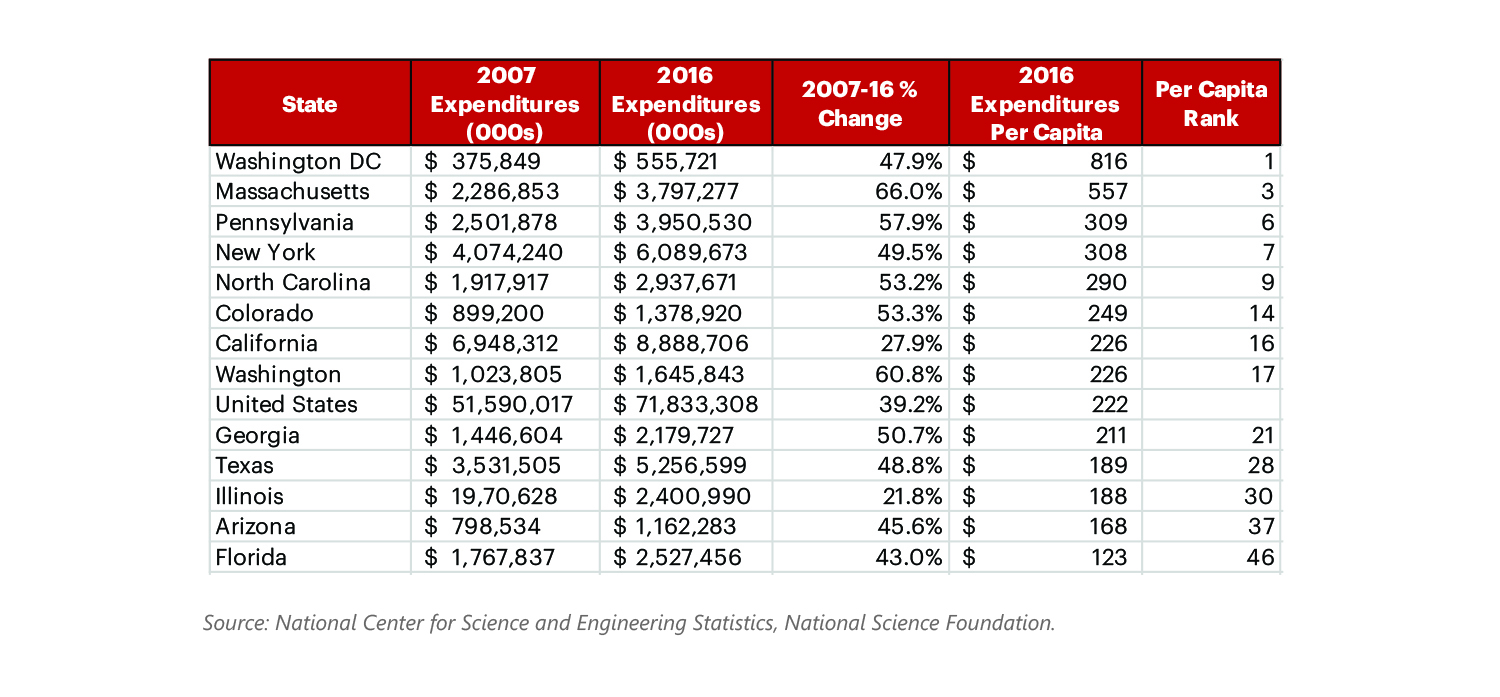
Table 8a: Total and Per Capita NIH Grant Award Amount, 2017
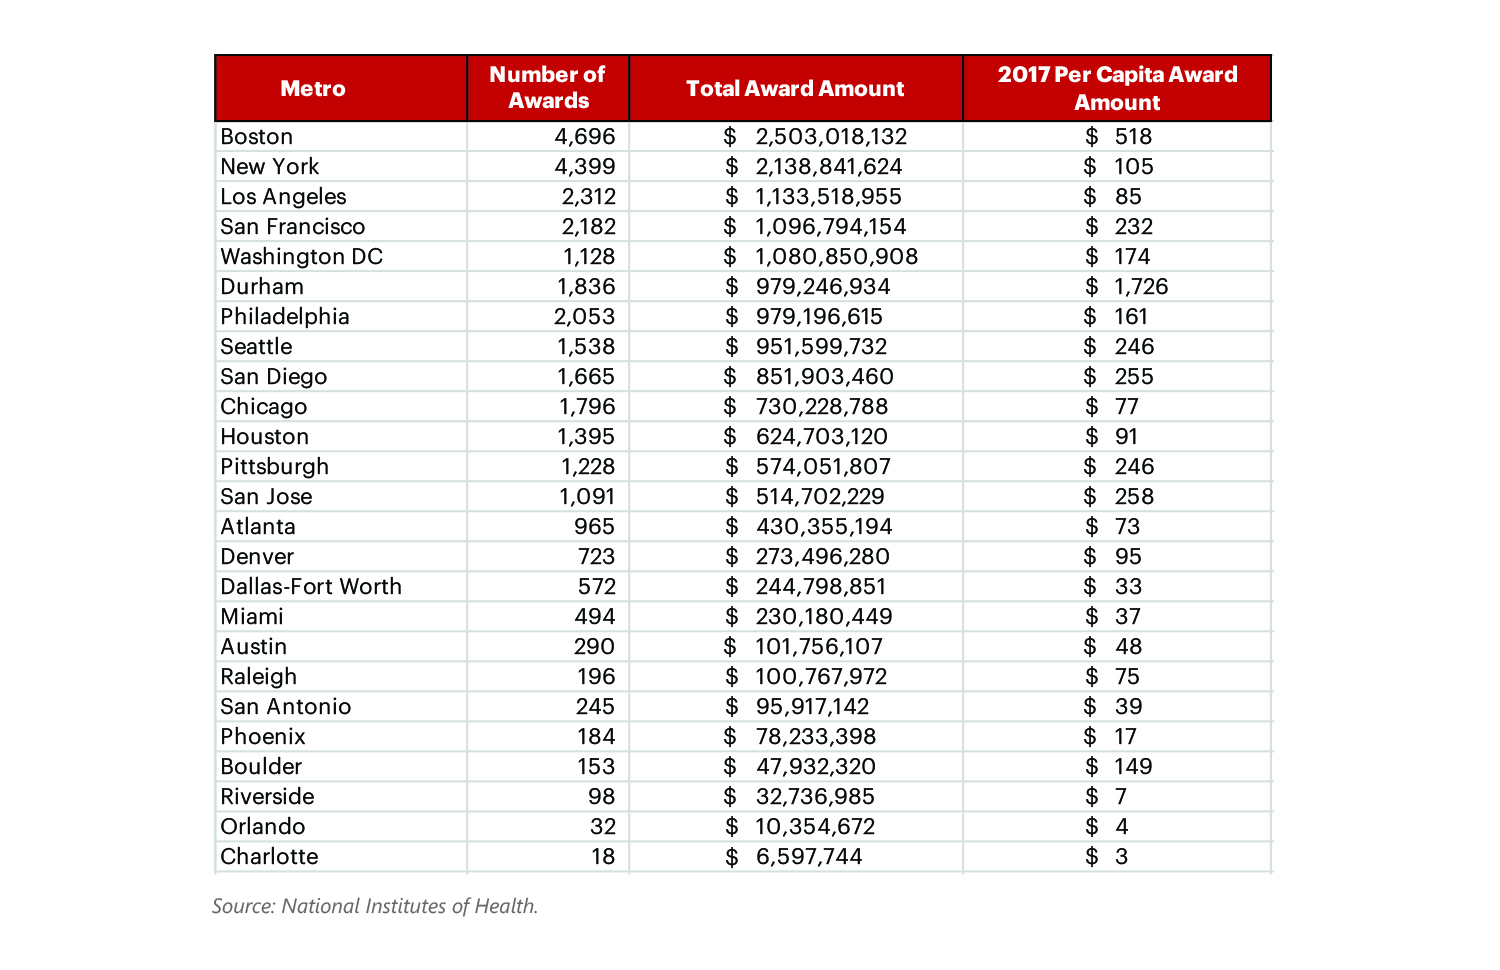
Table 8b: National Institutes of Health (NIH) R&D Funding by Texas MSA, 2017

Table 9: Total Number and Amount SBIR and STTR Grant Awards, 2008-2017
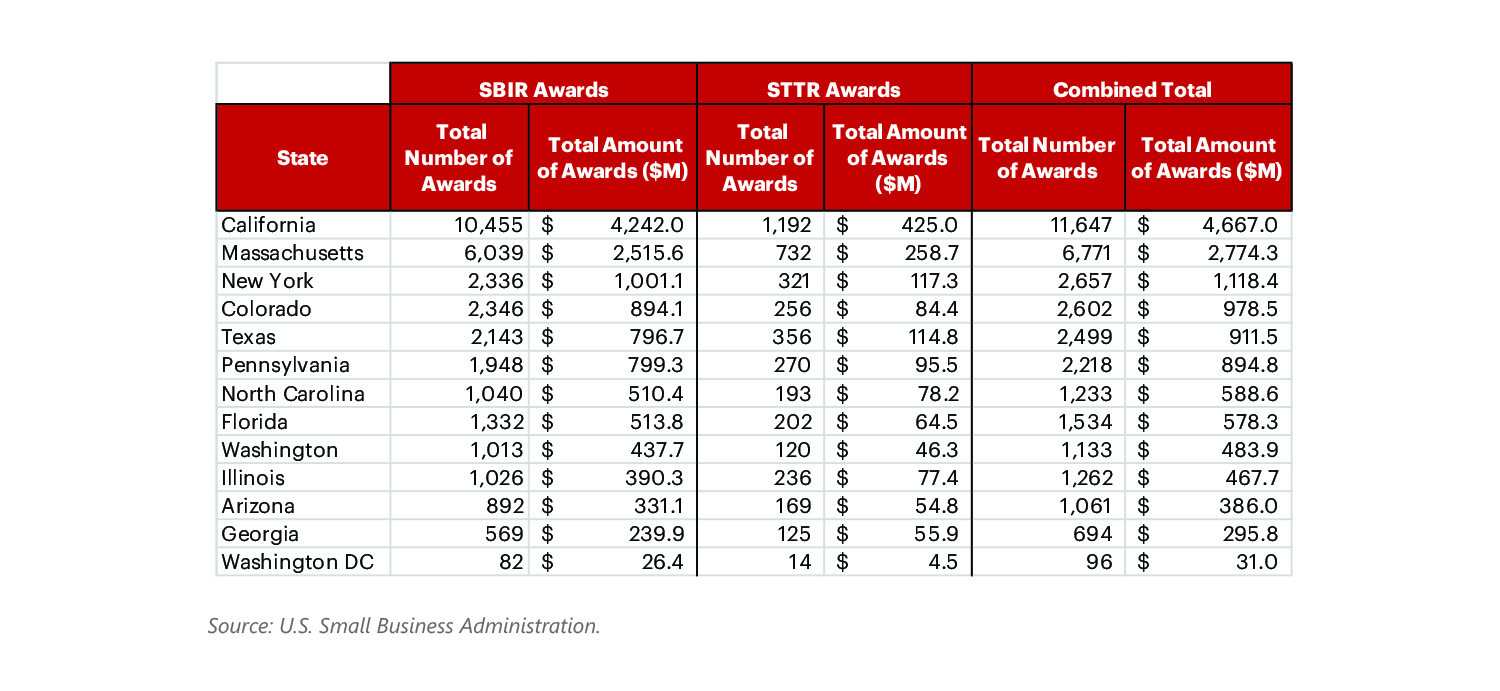
Table 10: Venture Capital Investments and Return on Investment, 2011-2017
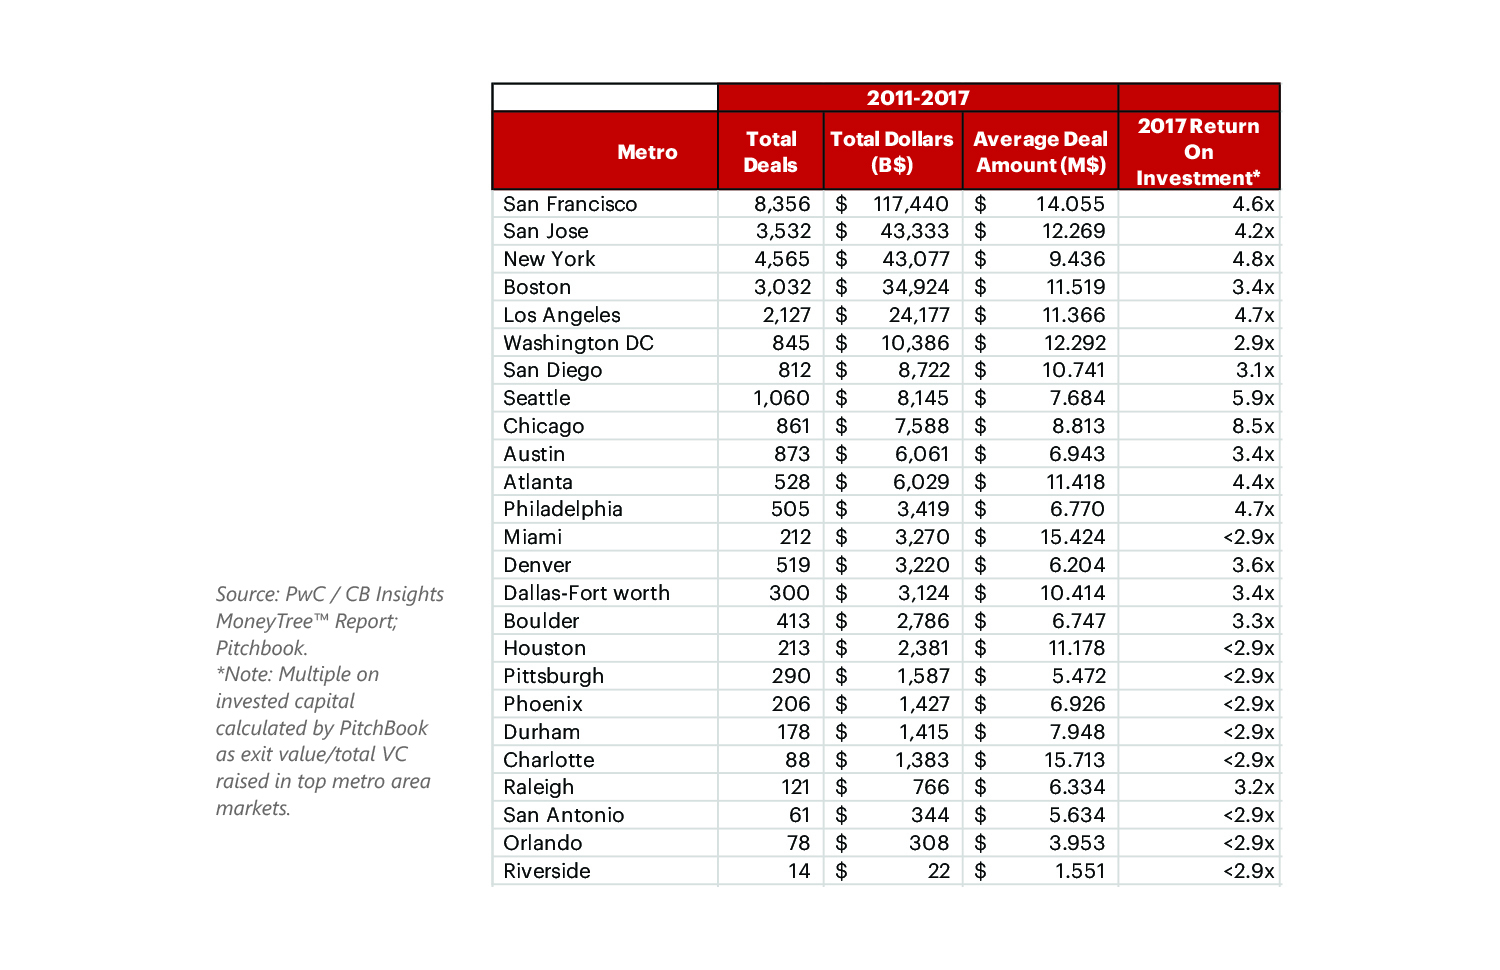
Table 11: Workforce and Labor Force Participation Rate, 2016
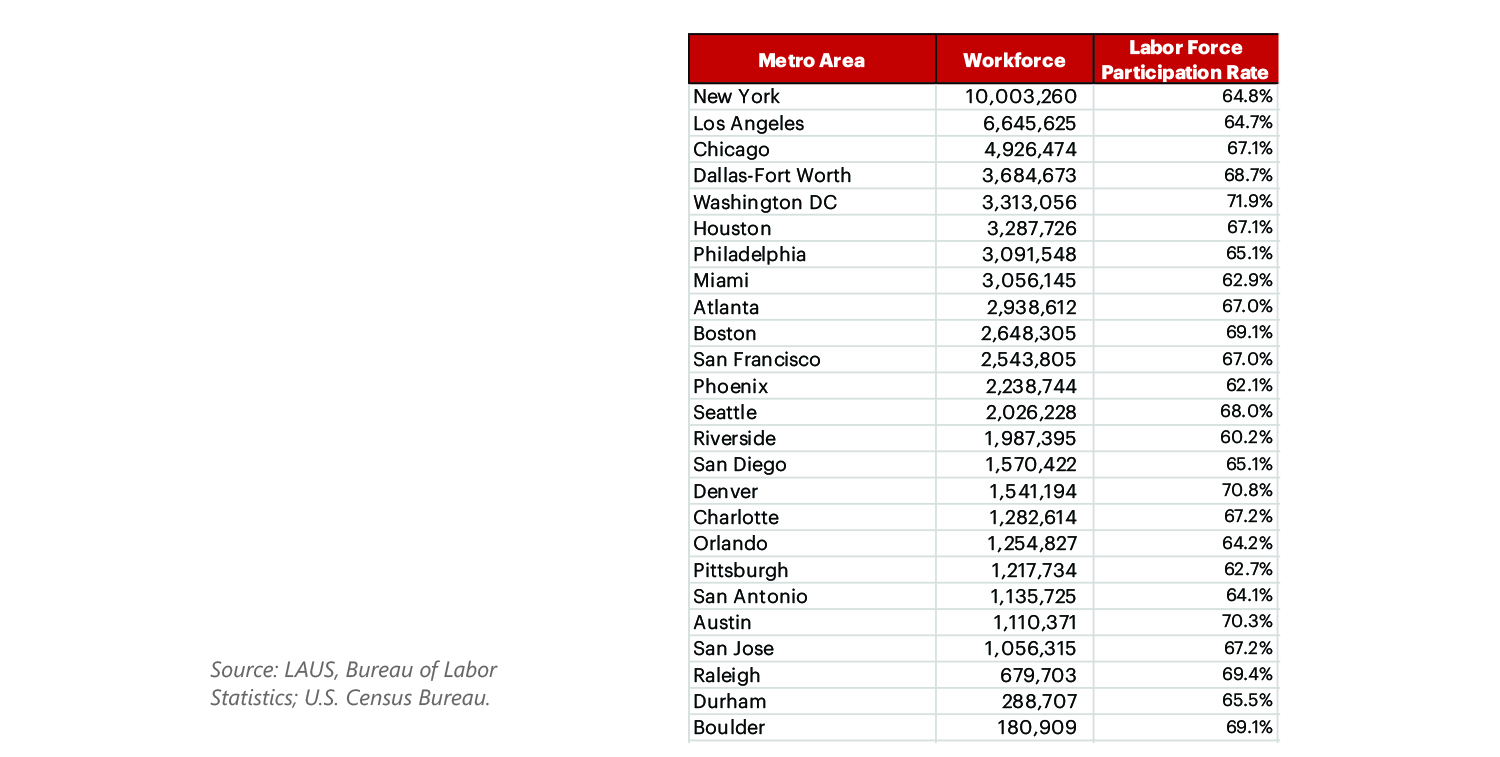
Table 12: High Tech Occupations Employment, 2018Q1
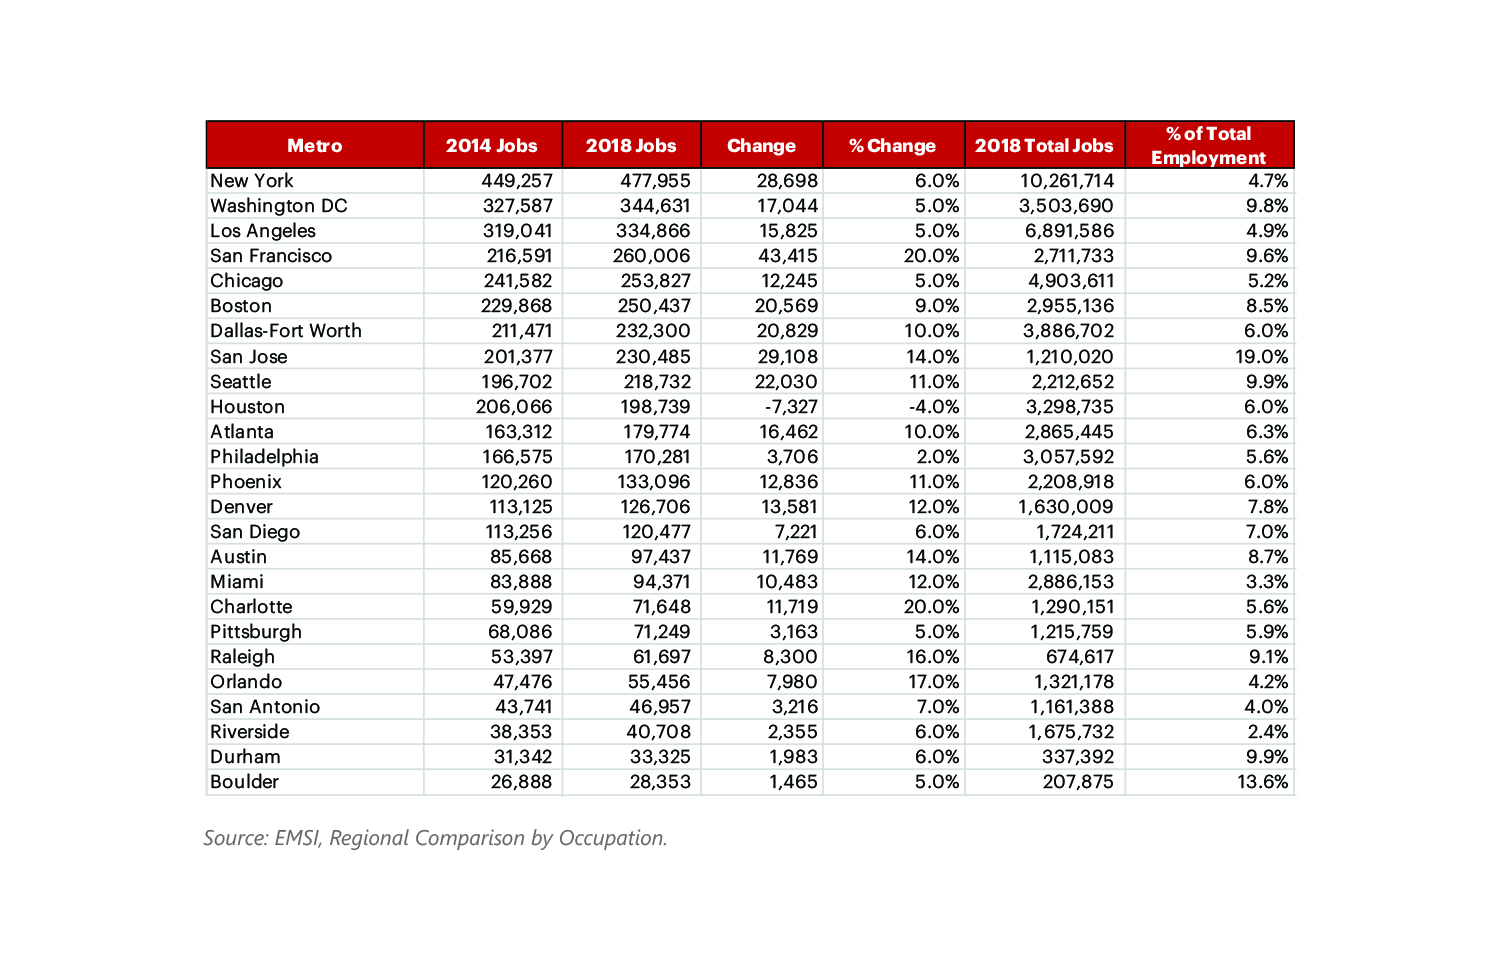
Table 13: STEM Occupation Employment, 2018Q1
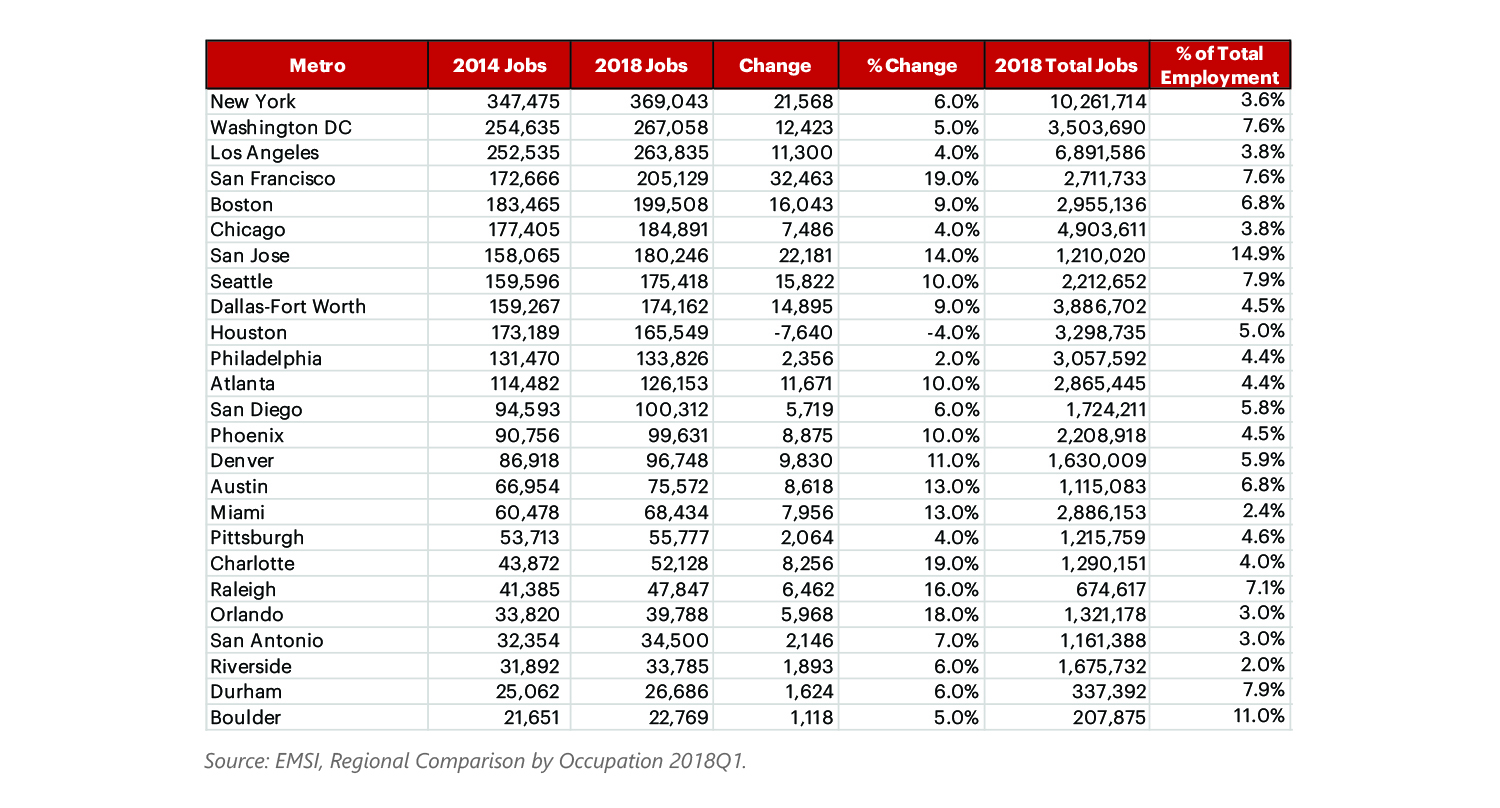
Table 14: Creative Industry Employment and Establishments, 2018Q1
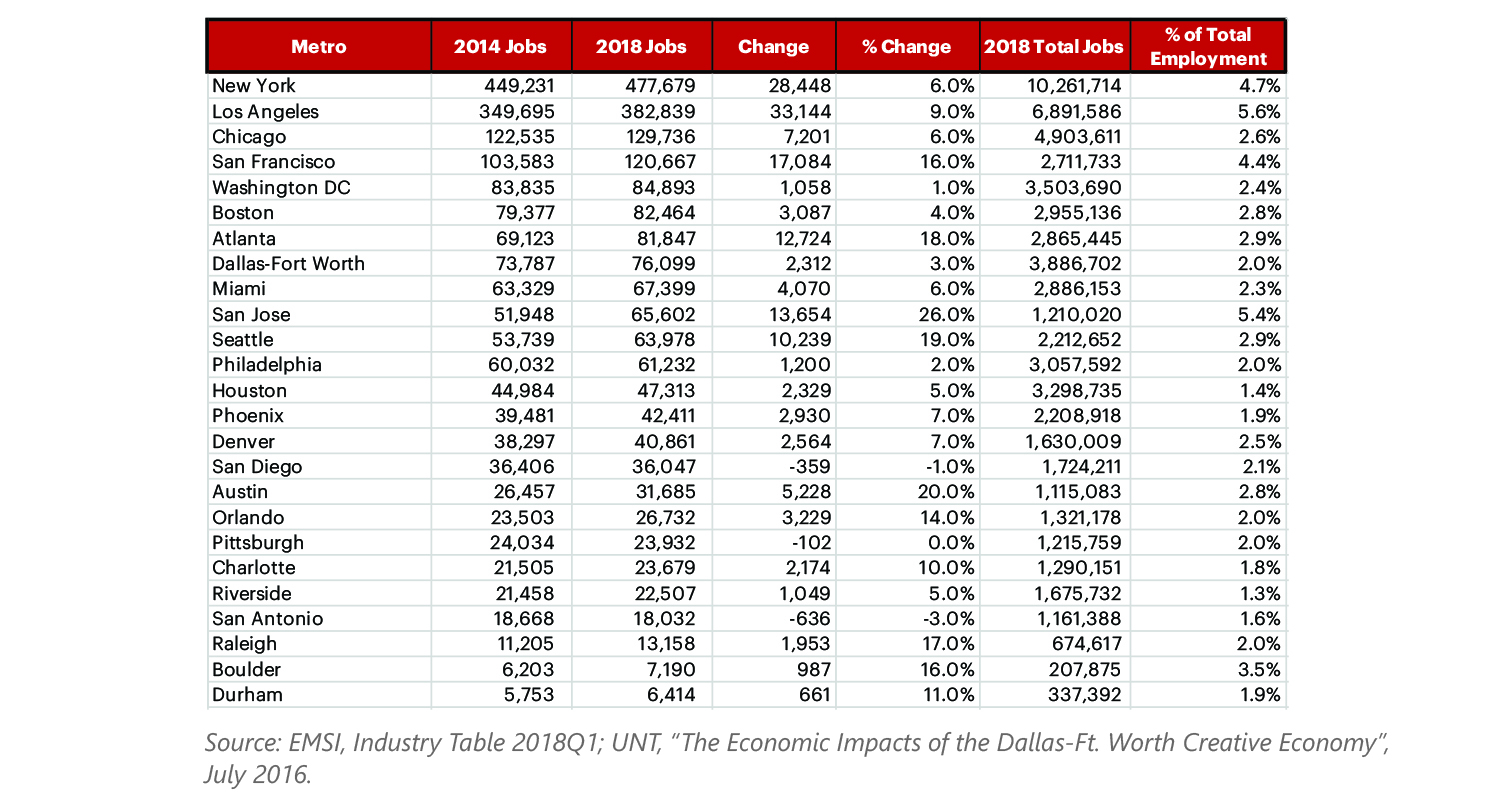
Table 15: Gross Metro Product, 2007-2016
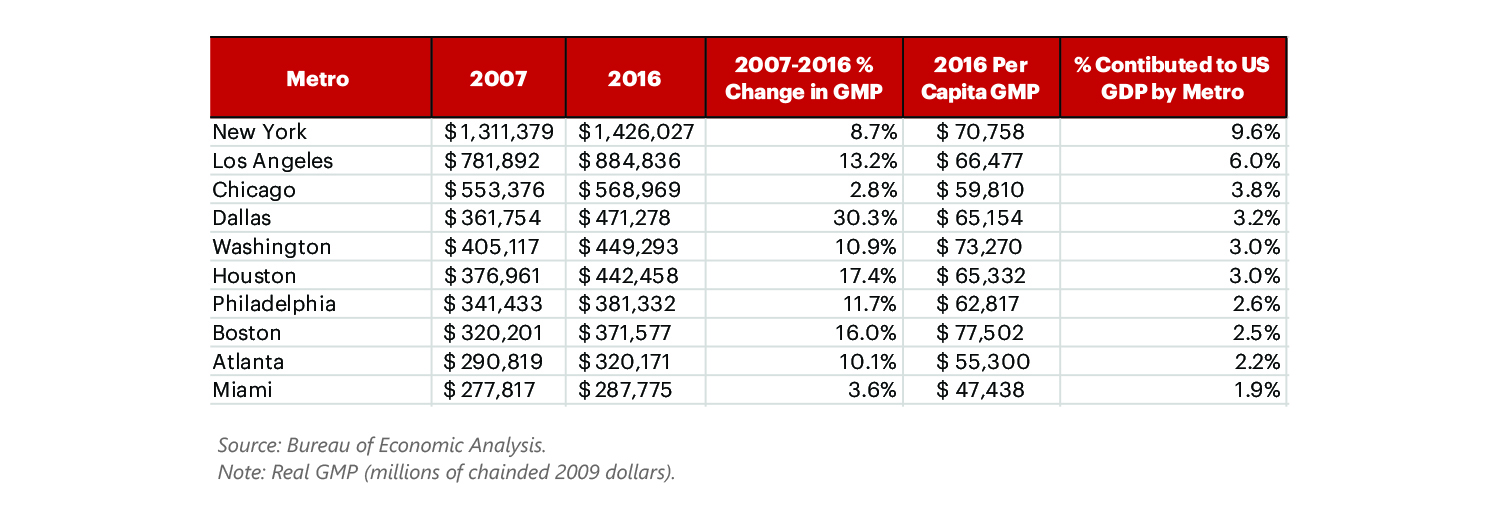
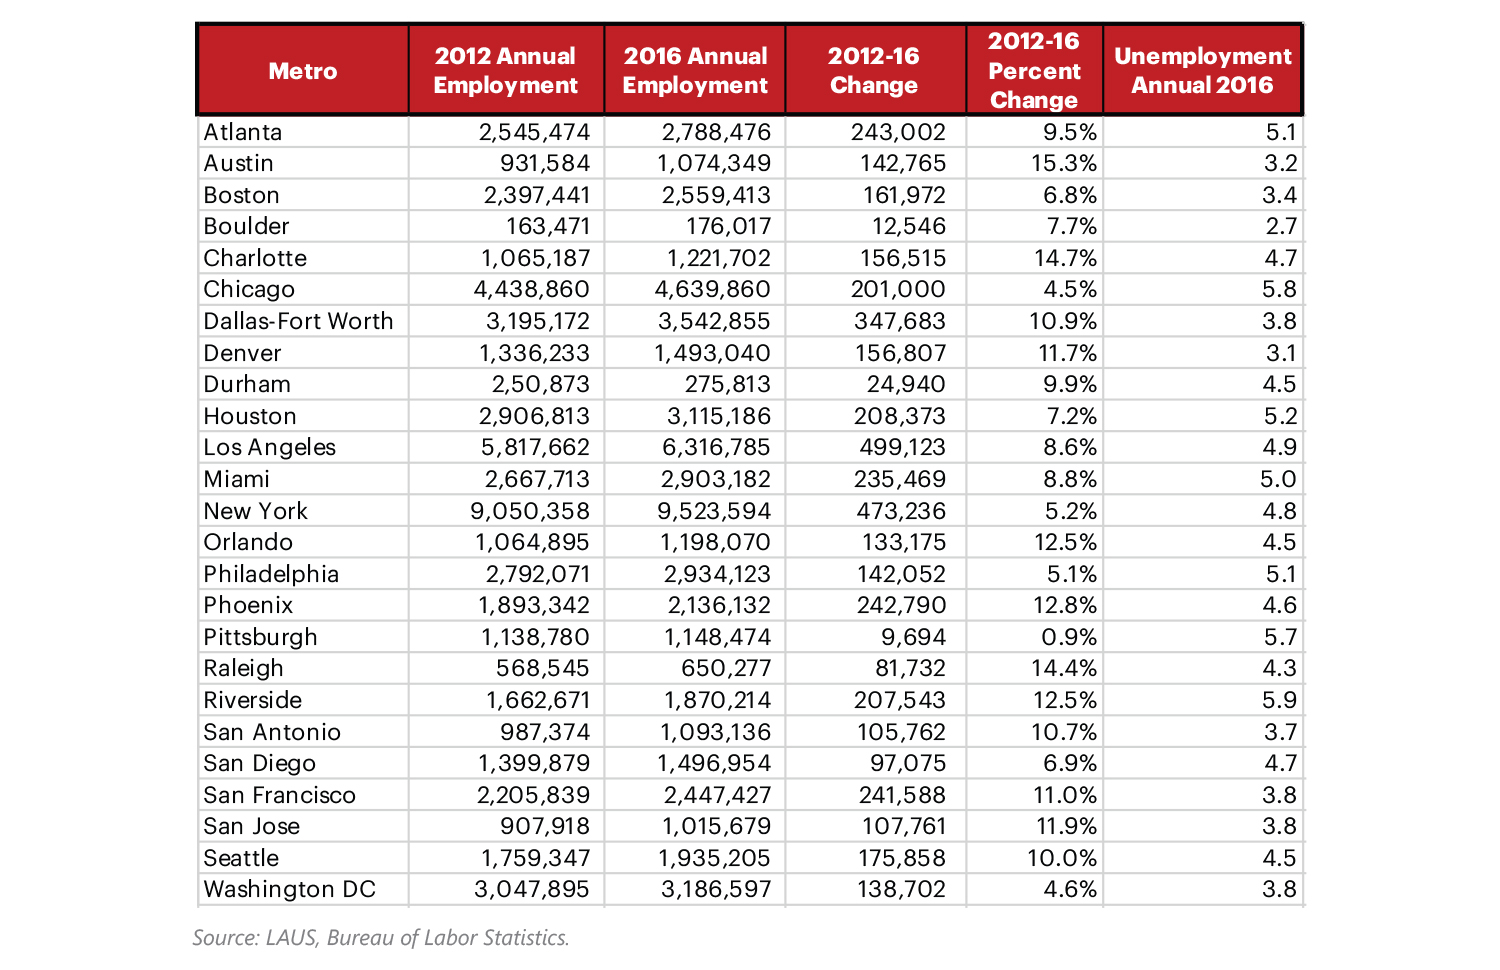
Table 16: Employment Growth, 2012-2016
READ NEXT
PART 1: DFW INNOVATION ECONOMY
Metropolitan Rankings from Trustworthy Sources
Part one captures how experts position DFW as a center for innovation. See how DFW stacks up in a Scorecard that benchmarks our rankings against peer cities.
PART 2: DFW INNOVATION ECONOMY
People Power
Part two in our innovation economy series highlights population growth and talent attraction as a first look at regional innovation potential. Here’s how DFW stacks up.
PART 3: DFW INNOVATION ECONOMY
Learning to Adapt
Part 3 of our innovation economy series explores the theme of knowledge — the current state of educational attainment and the quality of educational opportunities by metro area. Here’s how DFW stacks up, in four charts.
PART 4: DFW INNOVATION ECONOMY
The Next Big Breakthrough
Part 4 of our innovation economy series examines the role of ideas — where they are nurtured and how to protect them.
PART 5: DFW INNOVATION ECONOMY
Business Climate
Part 5 of our innovation economy series explores entrepreneurial communities and why metros including DFW are increasing efforts to support them.
PART 6: DFW INNOVATION ECONOMY
Capital Inputs
Part 6 of our innovation economy series addresses access to capital — and where we stand — in 4 charts.
PART 7: DFW INNOVATION ECONOMY
The Entrepreneurial Drive
Part 7 of our innovation economy series explores entrepreneurial communities and why metros including DFW are increasing efforts to support them.
PART 8: DFW INNOVATION ECONOMY
Workforce
In Part 8 of our series on the drivers of an innovation economy, we look at the single biggest contributor—local talent. Here’s how we stack up, in 4 charts.
PART 9: DFW INNOVATION ECONOMY
Stability
Part 9 of our series looks at metrics that help to describe the overall economic stability of the region.
PART 10: DFW INNOVATION ECONOMY
Appendix
Here are some of the metrics behind each chapter of the DFW Innovation Guide.
![]()
Get on the list.
Dallas Innovates, every day.
Sign up to keep your eye on what’s new and next in Dallas-Fort Worth, every day.


