SERIES: PART 9
The Dallas-Fort Worth Regional Innovation Assessment 2018
DFW Innovation Economy is a serial look at chapters from the 2018 Innovation Assessment produced by the Dallas Regional Chamber (DRC) and Accenture. Each chapter of the Assessment comprises key metrics that can be tracked over time to evaluate the strength of Dallas-Fort Worth’s innovation economy in relation to competitor metropolitan areas. Measures related to patent production, venture capital flows, educational attainment, business climate and various metropolitan rankings help to paint a picture of innovation-driven economic growth potential of DFW.
In this ninth and final installment about the drivers of an innovation economy, we look at metrics that help to describe the overall economic stability of a region. Although innovation is often a product of necessity, a firm economic base can provide a longer runway or entrepreneurs to achieve their vision. Elements of a firm base include industry diversity, strong productivity, growing employment, and wages that are commensurate with the cost of living. Also, the economic stability of a region can be an attractive feature for businesses and individuals looking to relocate. For a look at the data, this appendix shares some of the metrics behind each chapter of the DFW Innovation Guide.
PRODUCTIVITY AND WEALTH
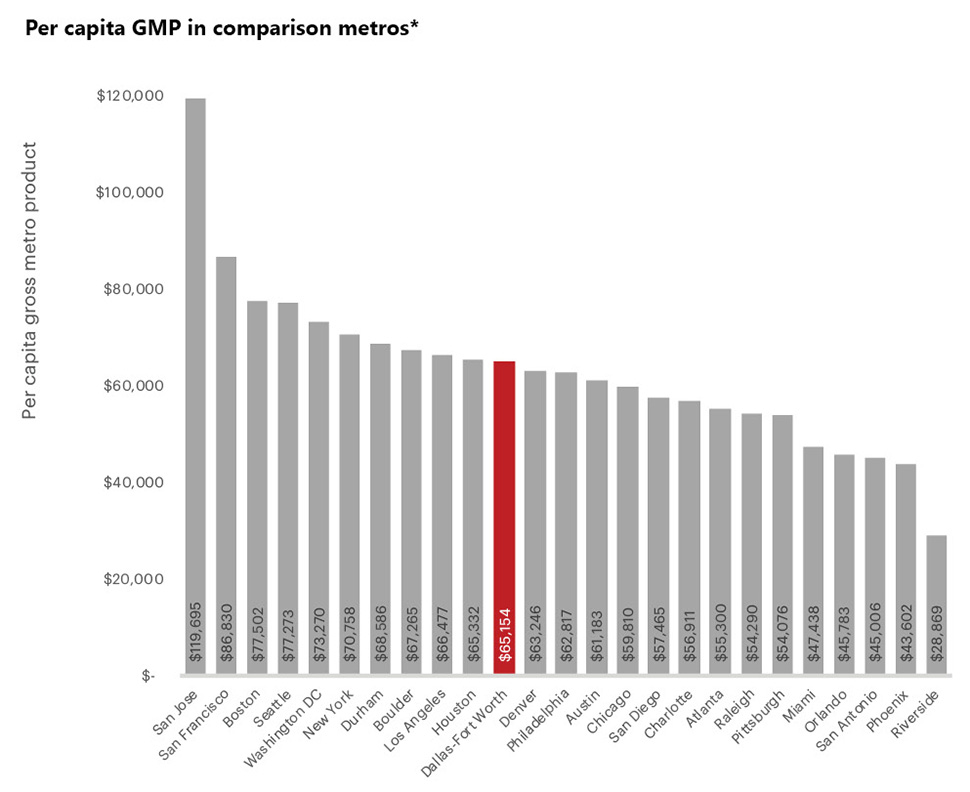
Gross metro product, or GMP, is the value of all goods and services produced within a metropolitan area and signals the level of economic productivity in a region. In general, metro areas drive the US economy. In fact, the 10 largest metros contribute nearly 38 percent of the US GDP. New York and Los Angeles are ahead of the other metros in terms of their contribution to national GDP, with 9.6 percent and 6.0 percent, respectively. DFW ranks fourth, at 3.2 percent of GDP. Important to note, though, is that underlying DFW’s contribution is a seven-year GMP growth rate of more than 30 percent, the fastest among the top 10 metros. DFW’s per capita GMP stands at $65,154, indicating the region is both highly productive and is creating wealth.
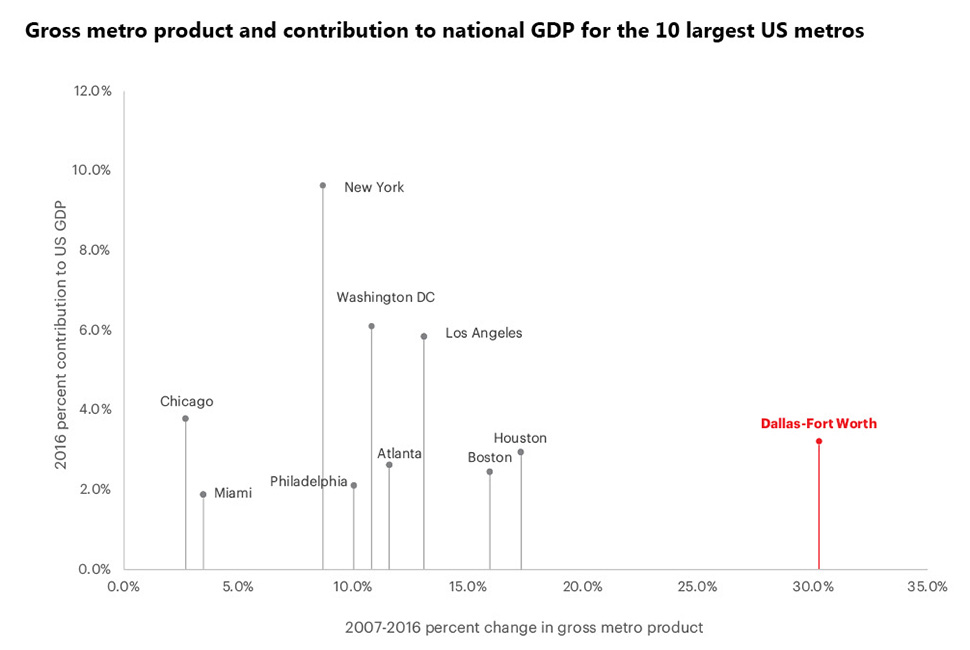
Source: Bureau of Economic Analysis, 2007-2016.
*Note: Real GMP (millions of chained 2009 dollars).
Source: Bureau of Economic Analysis, 2016.
WAGES AND SALARIES
Average annual salary and median hourly wage are important measures for describing the stability of a regional economy, and can be affected by cost of living, and occupation and industry composition. Average salaries provide an overview of the income generated by the entire region as if it were equally distributed, but higher-earning individuals have a stronger influence on the mean value than those with lower earnings. The median wage, or middle value, is more reflective of what the typical person might earn. Average annual salaries range from a low of $52,237 in Orlando to a high of $130,850 in San Jose, and median hourly wages range from a low of $15.10 in Orlando to a high of $28.70 in San Jose. DFW falls in the middle of the pack, for both measures, at $67,199 and $18.46, respectively.
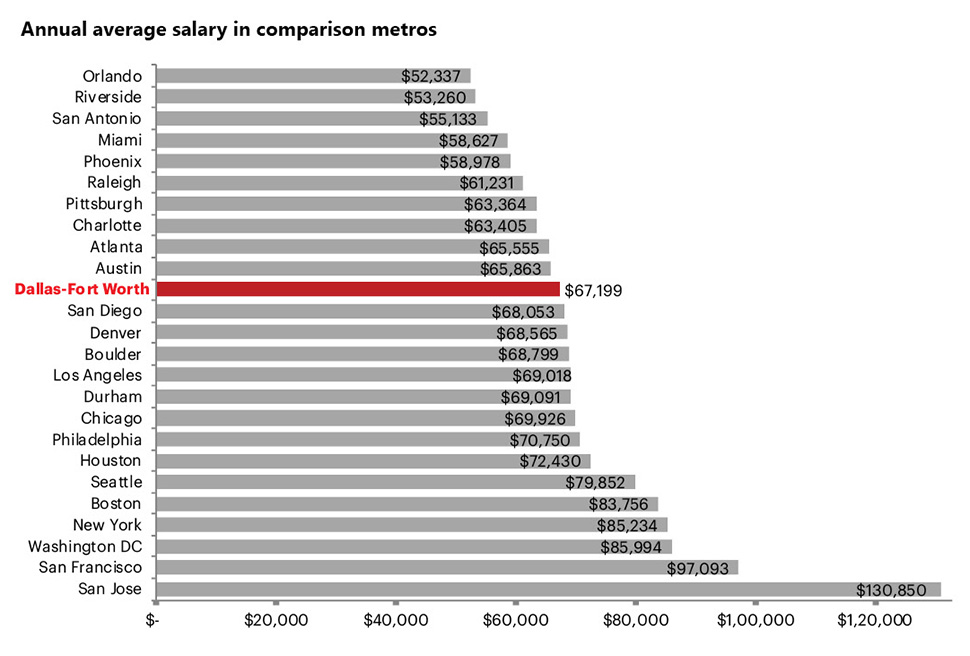
Source: EMSI, 2018Q2.
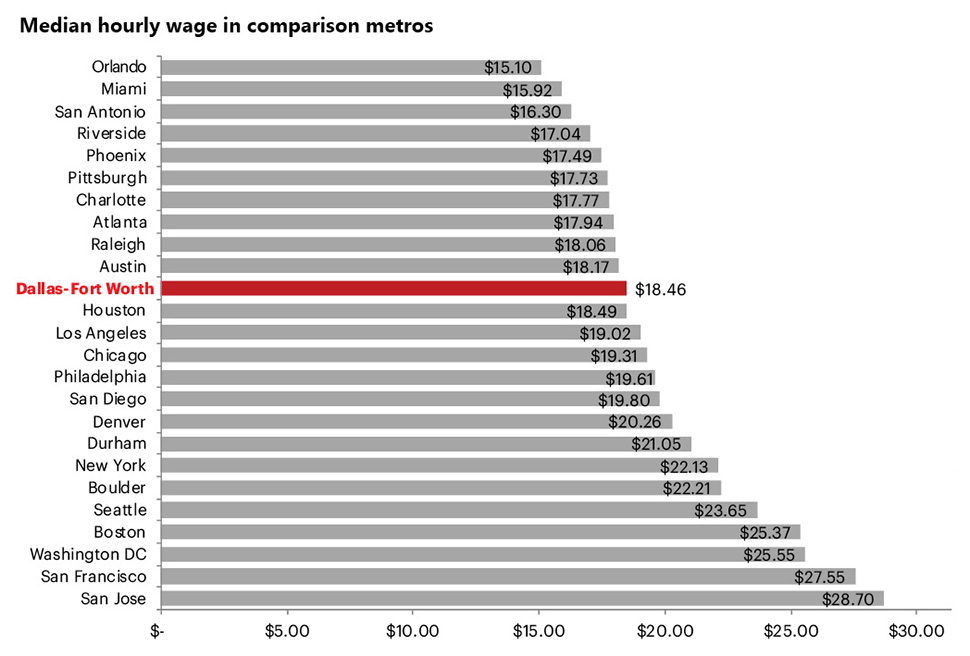
Source: OES, Bureau of Labor Statistics, 2016.
EMPLOYMENT AND UNEMPLOYMENT
Employment growth among metros represents an important indicator of a healthy economy both from the standpoint of business creation and expansion, and from the ability of a region to create and attract the talent necessary to meet demand. The unemployment rate is the share of the labor force that is jobless. It also serves as an indicator of whether the regional workforce possesses the skills that employers require. In the past five years, employers in DFW have created almost as many jobs as were created in either Los Angeles or New York—two much larger metros in both population and GMP. Unemployment in DFW has remained low, nearly a full percentage point below the national average.
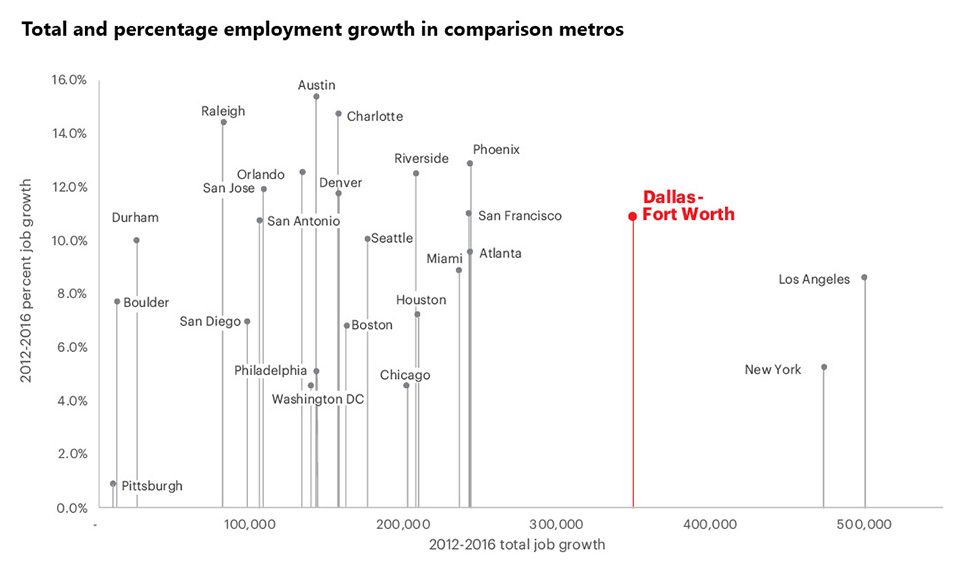
Source: LAUS, Bureau of Labor Statistics, 2012–2016.
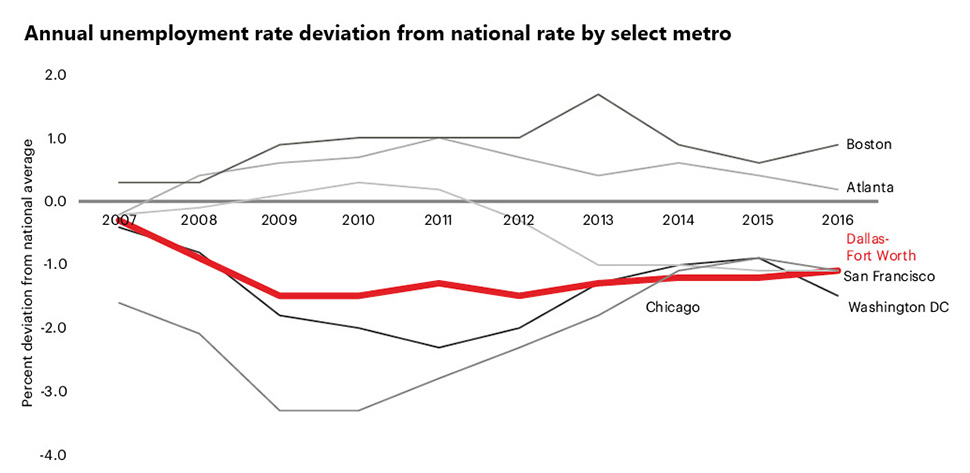
Source: LAUS, Bureau of Labor Statistics, 2012–2016.
COST OF LIVING
People consider many different factors in their decisions to relocate. C2ER’s Cost of Living Index (COLI) helps by comparing prices of a set of goods, services, housing and other expenses among participating US metros. C2ER partners with local organizations that volunteer to collect data on the ground. The resulting bundles of living expenses for each metro are compared with the national average (equal to 100) and to one another. The further a score exceeds the average, the more someone can expect to pay for living expenses. With an index score of 102.1, DFW has the third-lowest COLI among the top 10 most-populated metros, after Atlanta (99.0) and Houston (98.2). DFW’s cost of living is a compelling factor in maintaining an Innovation Economy.
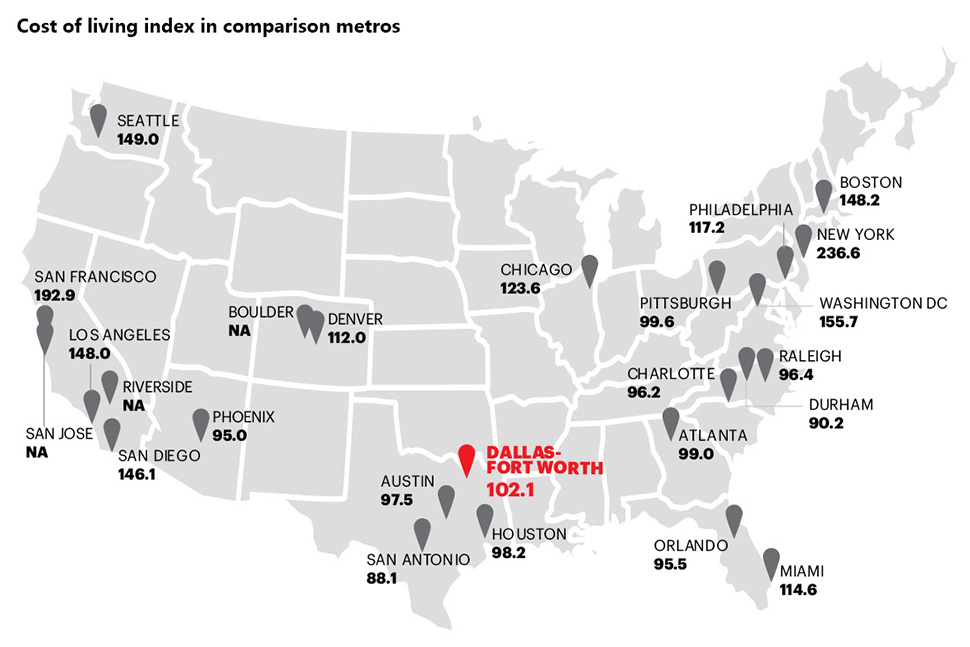
Source: Annual Cost of Living Index, C2ER, 2017.
THE POVERTY CHALLENGE
The poverty rate is the ratio of people who fall below the poverty line to the total population. The poverty line is based on estimates of the level of income needed to cover basic needs, as determined by the federal government. Poverty plagues all metros regardless of how innovative they are perceived to be. The poverty rate can highlight inequities in resource distribution within a metro and can negatively impact innovation potential. The poverty rate of most major metros is currently between 10.0 percent and 16.0 percent, with a high of 17.7 percent in Riverside to a low of 8.4 percent in Washington, DC.
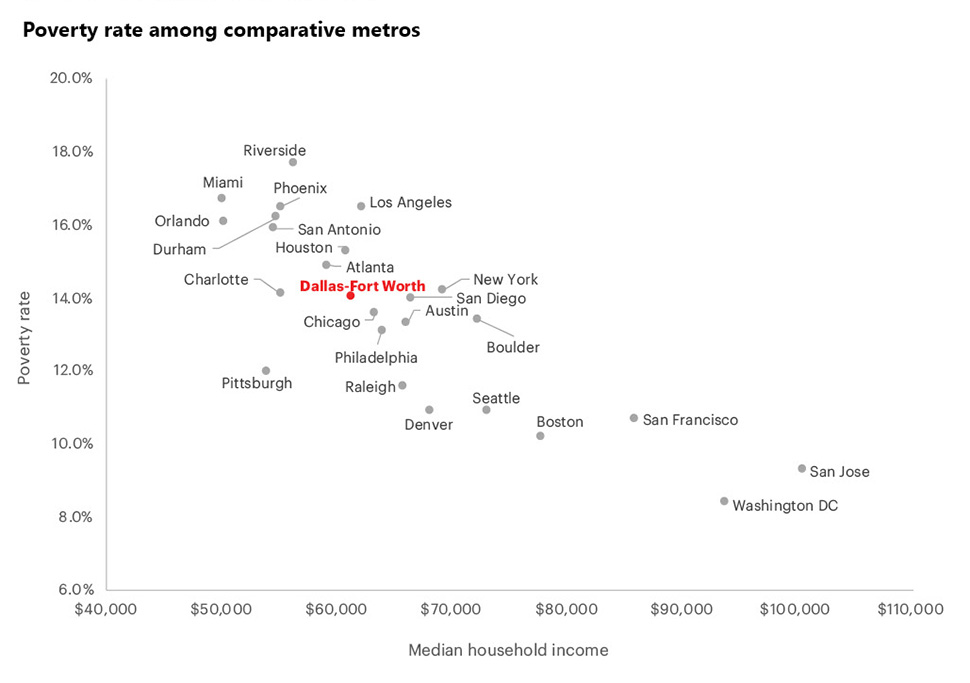
Source: American Community Survey 5-Year Estimates, US Census Bureau, 2012–2016.
READ NEXT
PART 1: DFW INNOVATION ECONOMY
Metropolitan Rankings from Trustworthy Sources
Part one captures how experts position DFW as a center for innovation. See how DFW stacks up in a Scorecard that benchmarks our rankings against peer cities.
PART 2: DFW INNOVATION ECONOMY
People Power
Part two in our innovation economy series highlights population growth and talent attraction as a first look at regional innovation potential. Here’s how DFW stacks up.
PART 3: DFW INNOVATION ECONOMY
Learning to Adapt
Part 3 of our innovation economy series explores the theme of knowledge — the current state of educational attainment and the quality of educational opportunities by metro area. Here’s how DFW stacks up, in four charts.
PART 4: DFW INNOVATION ECONOMY
The Next Big Breakthrough
Part 4 of our innovation economy series examines the role of ideas — where they are nurtured and how to protect them.
PART 5: DFW INNOVATION ECONOMY
Business Climate
Part 5 of our innovation economy series explores entrepreneurial communities and why metros including DFW are increasing efforts to support them.
PART 6: DFW INNOVATION ECONOMY
Capital Inputs
Part 6 of our innovation economy series addresses access to capital — and where we stand — in 4 charts.
PART 7: DFW INNOVATION ECONOMY
The Entrepreneurial Drive
Part 7 of our innovation economy series explores entrepreneurial communities and why metros including DFW are increasing efforts to support them.
PART 8: DFW INNOVATION ECONOMY
The Entrepreneurial Drive
Part 7 of our innovation economy series explores entrepreneurial communities and why metros including DFW are increasing efforts to support them.
![]()
Get on the list.
Dallas Innovates, every day.
Sign up to keep your eye on what’s new and next in Dallas-Fort Worth, every day.
R E A D N E X T
-
Five local winners received up to $200,000 in funding to activate their solutions throughout North Texas.
-
The U.S. Innovation and Competition Act, which passed in May, has the power to develop 20 tech hubs throughout the United States. According to Tech Titans' CEO Bill Sproull, Dallas-Fort Worth could be a strong contender for one of those spots.
-
With five new UT Dallas research centers, an extension of the university's Venture Development Center, and new attractions like TheLab makerspace, The IQ may just realize Richardson's vision to be "the premier tech hub in Texas."
-
The DFW Alliance of Technology and Women held its 19th annual Executive Forum last week, urging attendees to "crack the courage code" and empower women in business. Afterward, DFW*ATW's president, Shanthi Rajaram, spoke with Dallas Innovates about her takeaways from the event—and how being "comfortable with the unknown" helped her start her own entrepreneurship journey.