
SERIES: PART 5
The Dallas-Fort Worth Regional Innovation Assessment 2018
DFW Innovation Economy is a serial look at chapters from the 2018 Innovation Assessment produced by the Dallas Regional Chamber (DRC) and Accenture. Each chapter of the Assessment comprises key metrics that can be tracked over time to evaluate the strength of Dallas-Fort Worth’s innovation economy in relation to competitor metropolitan areas. Measures related to patent production, venture capital flows, educational attainment, business climate and various metropolitan rankings help to paint a picture of innovation-driven economic growth potential of DFW.
In this fifth installment about the drivers of an innovation economy, we look at the impact of the local business climate.
Business leaders pay particular attention to the legal and regulatory conditions in the regions in which they operate. They also try to predict how potential changes to these conditions might affect a company’s ability to function. Onerous conditions may spur the decision to consider relocating to another market where tax structures, policy prescriptions, legislative responsiveness or other business climate factors are more favorable. High taxes, for example, can affect overall operating costs, which may affect the scale of production or ability to hire more workers. Of course, taxes aren’t the only consideration. The cost of doing business can be affected by many things, including labor, energy, transportation, and facilities. Furthermore, regional leaders can create legal and regulatory frameworks that maximize the use of local assets, resulting in exceptionally favorable conditions for specific industries.
COST OF DOING BUSINESS
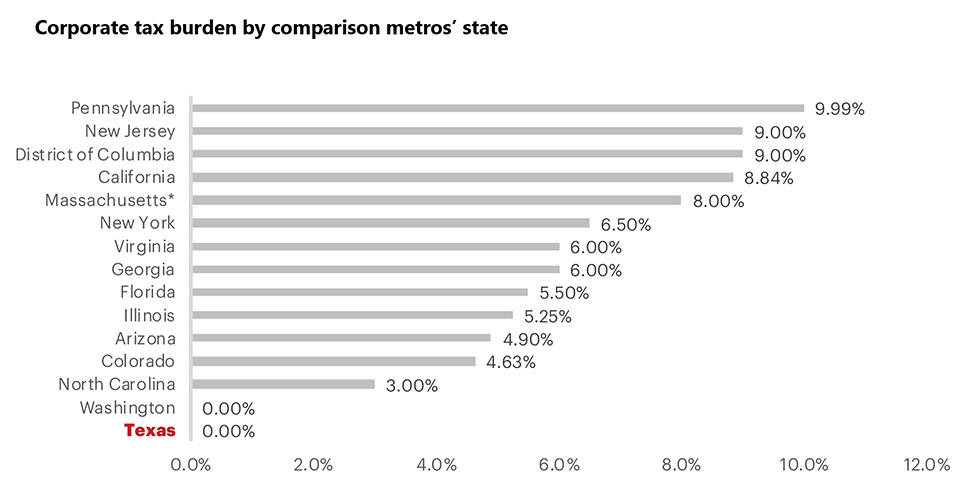
The cost of doing business can be influenced by a number of factors—labor, energy, tax and rent—though tax policy usually takes center stage. Among the states that are home to DFW’s comparative metros, corporate income taxes vary widely, from zero percent in Texas and Washington to 9.99 percent in Pennsylvania. Similarly, for taxes that have a more direct impact on innovation activity, states have wide-ranging tax policies. For instance, tax rates for new and mature R&D facilities can vary from as little as 0.8 percent in Georgia to 22.9 percent in New York, a reflection of differing philosophies about how best to support R&D activity. Texas’s low business tax burden plays a central role in keeping the overall cost of doing business in most Texas metros lower than the U.S. average. The U.S. cost of business index score is set at 100. Metros with a higher index have a higher cost of doing business, while the reverse is also true.
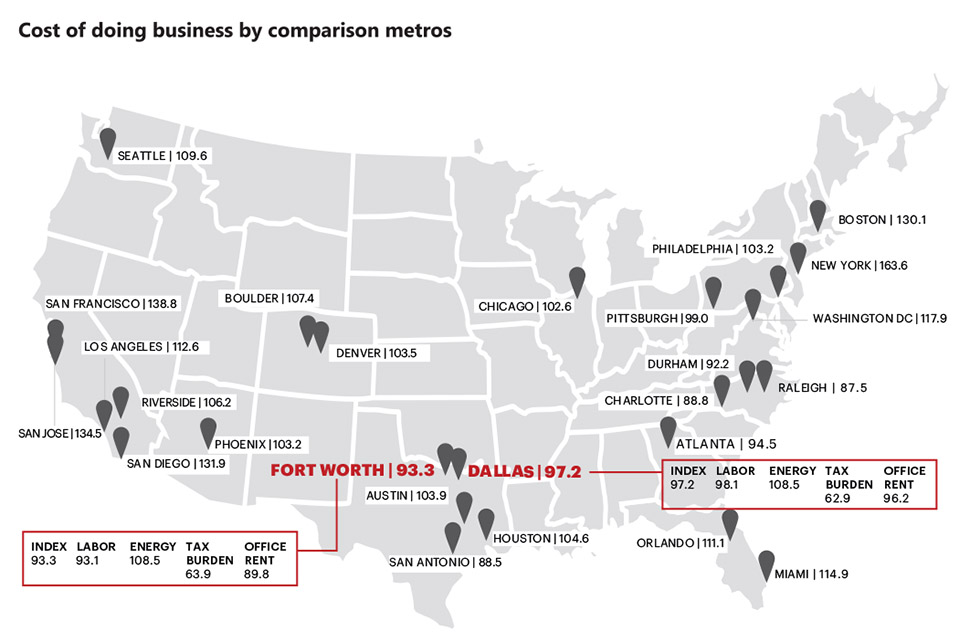
Source: Moody’s Analytics, 2017.
*Note: Plus $2.60 per $1,000 of property or net worth.
Source: Thomson Reuters, 2018
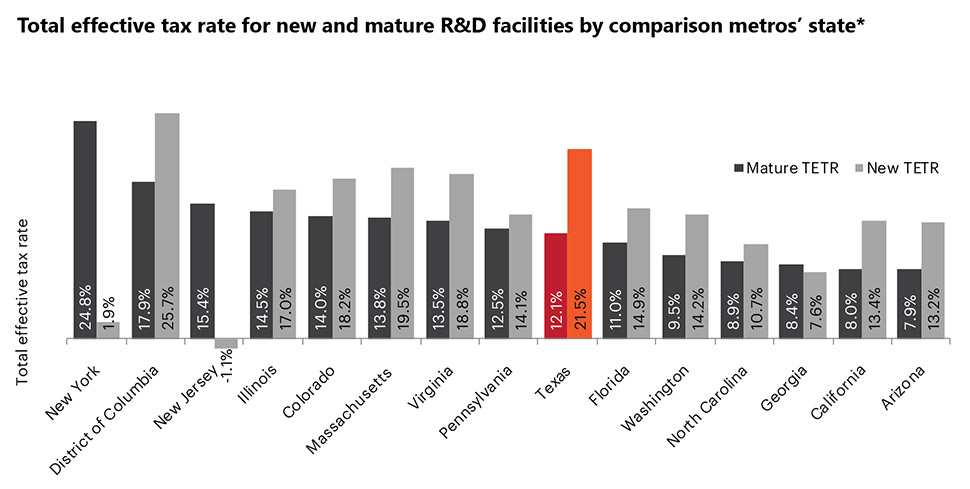
*Note: New facilities are less than 10 years old; mature facilities are more than 10 years old.
Source: Tax Foundation/KPMG, 2015.
THE DISTRIBUTION OF INDUSTRIES
A location quotient (LQ) is used to quantify the concentration of regional industries in relation to the rest of the nation. With the US representing an average of 1.0 for all industries, the further a metro deviates from this average reflects how dependent its economy is on one particular industry. The LQ can shed light on issues such as an abundance of a particular resource, including the number of graduates in a particular field, proximity to a natural resource, or political and policy decisions supporting the industry. For example, see Houston’s dominance in and reliance on the oil and gas industry below. High employment in a specific industry typically indicates the region’s economic base, which can strengthen or weaken in a relatively short period of time. For example, see Boulder’s rapid decline in the finance industry. The following industries exhibit the propensity to spur the greatest share of technological innovations.
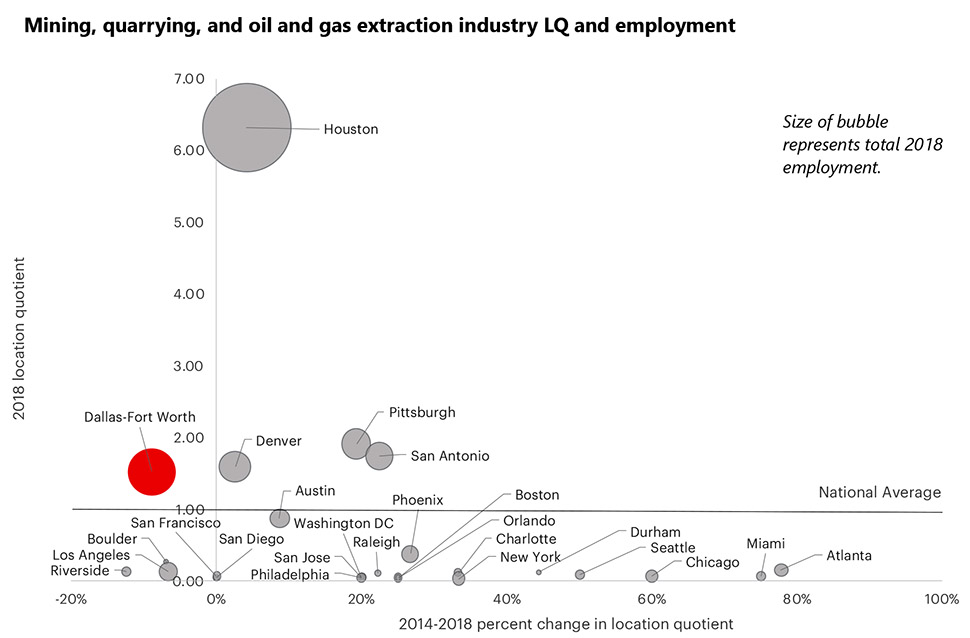
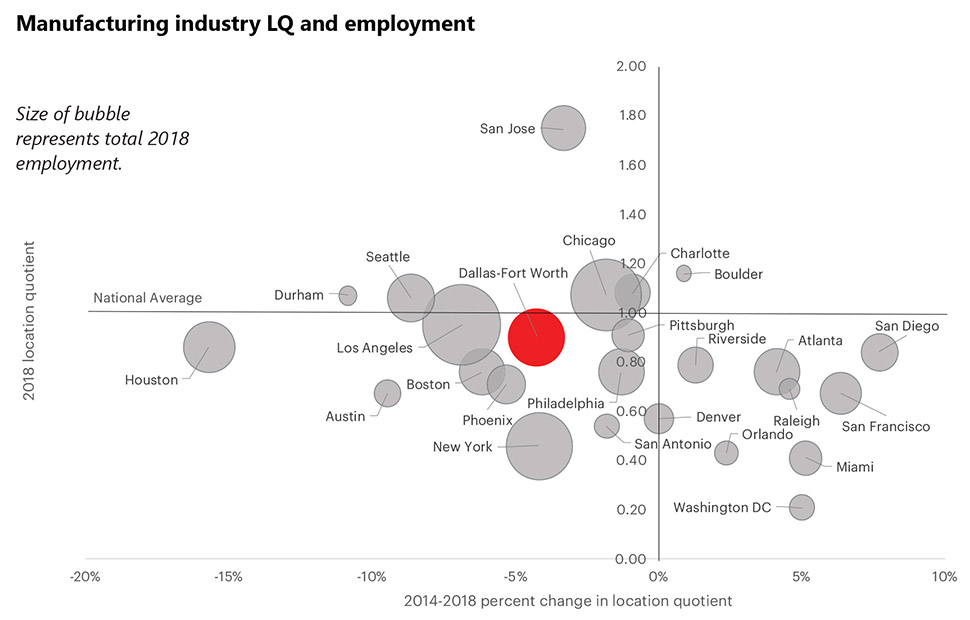
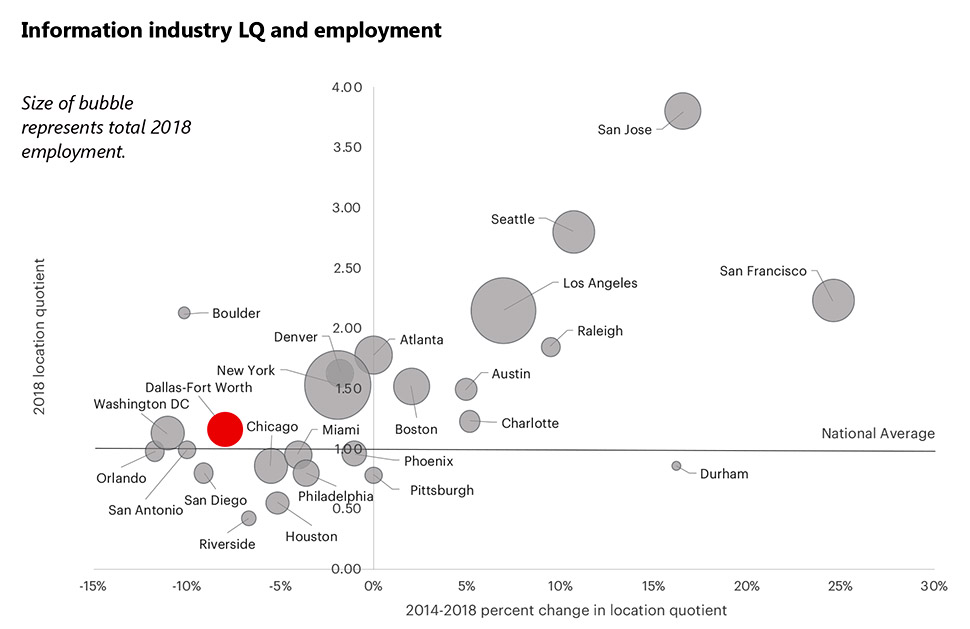
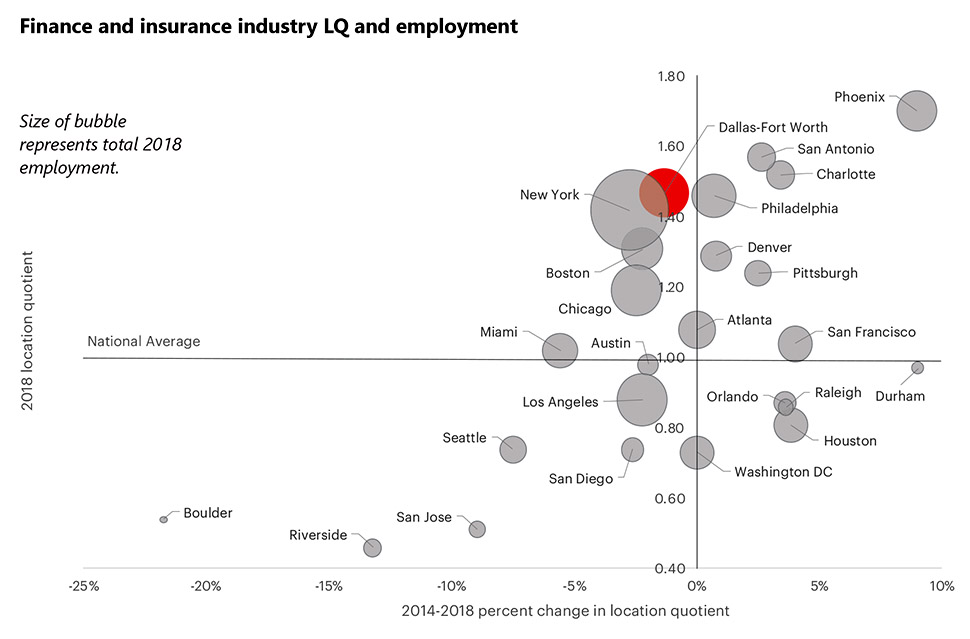
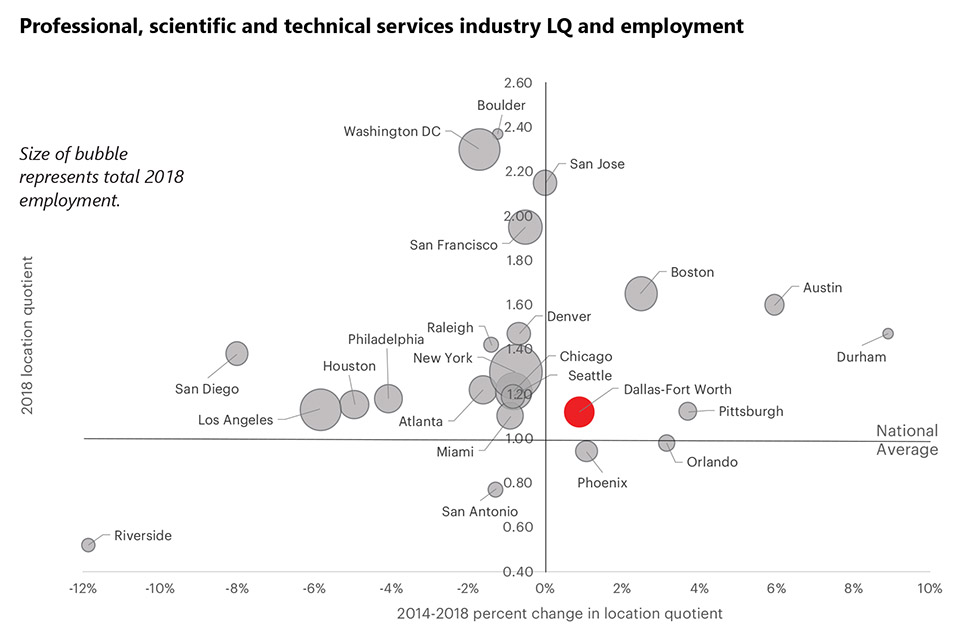
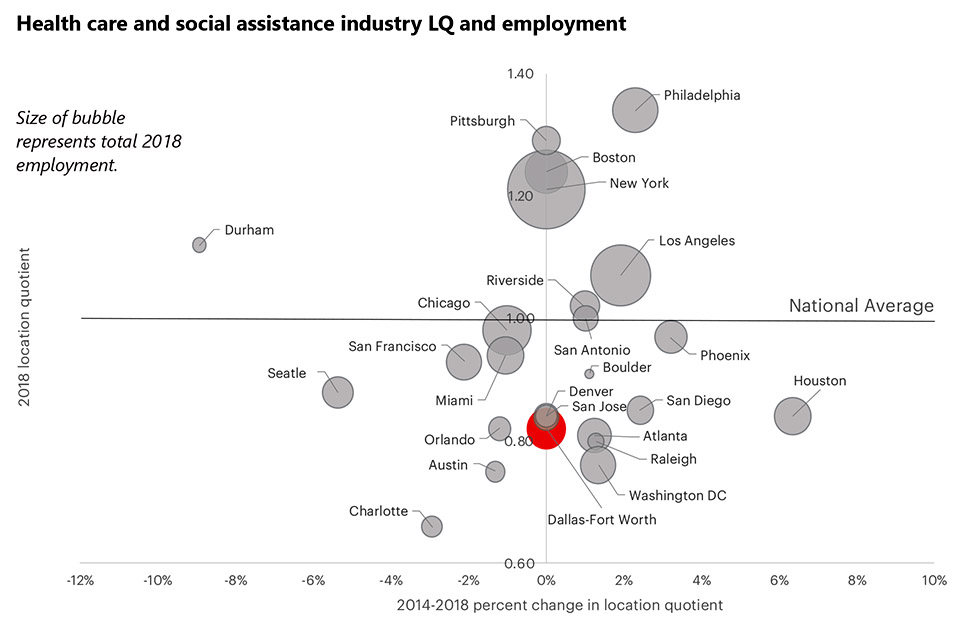
Source: EMSI, 2018Q2.
8/27/2018: The Cost of Doing Business map was corrected to show proper placement of Boulder and Denver.
READ NEXT
PART 1: DFW INNOVATION ECONOMY
Metropolitan Rankings from Trustworthy Sources
Part one captures how experts position DFW as a center for innovation. See how DFW stacks up in a Scorecard that benchmarks our rankings against peer cities.
PART 2: DFW INNOVATION ECONOMY
People Power
Part two in our innovation economy series highlights population growth and talent attraction as a first look at regional innovation potential. Here’s how DFW stacks up.
PART 3: DFW INNOVATION ECONOMY
Learning to Adapt
Part 3 of our innovation economy series explores the theme of knowledge — the current state of educational attainment and the quality of educational opportunities by metro area. Here’s how DFW stacks up, in four charts.
PART 4: DFW INNOVATION ECONOMY
The Next Big Breakthrough
Part 4 of our innovation economy series examines the role of ideas — where they are nurtured and how to protect them.
![]()
Get on the list.
Dallas Innovates, every day.
Sign up to keep your eye on what’s new and next in Dallas-Fort Worth, every day.
![]()
R E A D N E X T
-

North Texas has plenty to see, hear, and watch. Here are our editors' picks. Plus, you'll find more selections to "save the date."
-

Five local winners received up to $200,000 in funding to activate their solutions throughout North Texas.
-

Now in its third year, the program from Dallas Innovates and D CEO honors 78 disruptors and trailblazers driving a new vision for innovation in North Texas.
-

You’ve found Dallas Innovates’ archive of news briefs from April to June 2021.
-

The Water Cooler at Pegasus Park—the largest shared nonprofit space in Texas — is a place designed to accelerate impact, together. From Big Thought to SVP Dallas to The Trust for Public Land, the 15 ‘exceptional nonprofits' were picked after an application process last summer. They’ll join Water Cooler's five founding tenants.