SESSION ENCOURAGED THINKING VISUALLY, OUTSIDE THE BOX
Imagine a mutant outbreak where hundreds of super humans need to be classified based on their power level, age, last known location, affiliation and activity level.
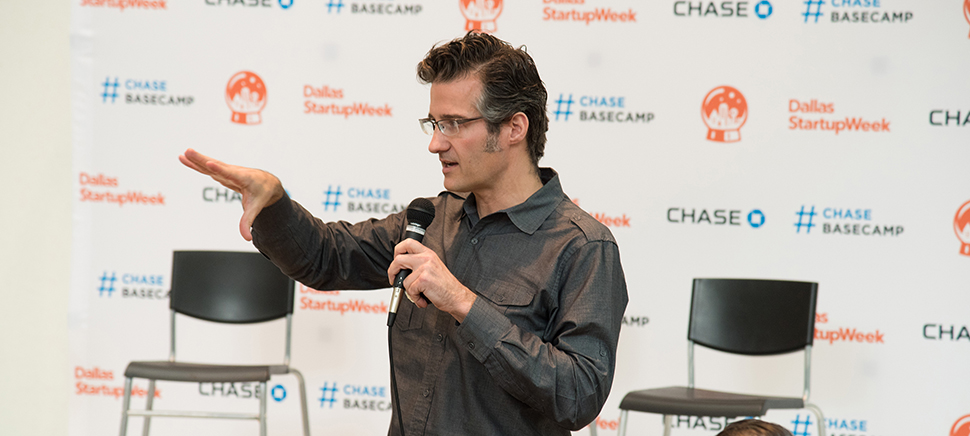
The challenge, issued by Stephen Anderson to the attendees at Dallas Startup Week seminar Tuesday afternoon, was to visually present the five data points in graphic form. The interactive seminar encouraged everyone to think outside the box and think visually, spatially and logically.
ON THE SURFACE: COLORS, DIFFERENT SHAPES, SIZES
To help them along, Anderson encouraged them to split the data into two planes: the top things (data points) and the substrate, the level below. It’s also important to prioritize which data points are the most important, such as power level and whether they are good or bad.
On the surface level, you can use colors, different shapes and shapes of different sizes. The substrate determines where the things are placed in a logical order. It could be a simple substrate, such as a geolocation map, or a more complex one that moves them around based on their power level or affiliation.
“The idea is, how to think visually about information and present it in a way that makes sense instantly to people.” -Stephen Anderson
“The idea is, how to think visually about information and present it in a way that makes sense instantly to people,” Anderson said.
The entrepreneurs who attended the conference could use these techniques to better illustrate their own goals and present complex and abstract concepts to potential investors, customers or other audiences.
It could explain everything from different types of coffee (featuring a breakdown of the ingredients that make an expresso different from a latte) to trying to understand how all the different Marvel superhero movies tie in together.
WEBSITES THAT ARE VISUAL MODELS
When asked what websites would be a great example of visual models, Anderson referred people to his Pinterest account where he posts great examples. Not all visual models are good, said Anderson, who has written several novels on the subject.
“I’ll see stuff with a lot of noise,” he said. “I’m always trying to help and train people to do visual models. I’m going to turn this into a teaching tool. I love teaching. I love sharing.”
Another exercise had the audience pick three numbers one through nine that would add up to 15. The first to do it wins. Then, he showed a much easier exercise where the numbers were placed in a tic-tac-toe pattern where they all added up to 15 horizontally, vertically and diagonally.
The second example went much quicker, obviously, because the numbers were already ordered in logical patterns. In this case, he said, the numbers were the top level and the grid pattern was the substrate.
It’s less information in your head and more on the page, Anderson said.
For a daily dose of what’s new and next in Dallas-Fort Worth innovation, subscribe to our Dallas Innovates e-newsletter.
R E A D N E X T
-
The hybrid event in August will take place in person at SMU and virtually. The seventh annual Dallas Startup Week powered by Capital One is Dallas-Fort Worth's largest event focused on driving entrepreneurial success, economic impact, and innovation in the region.
-

You'll find deadlines coming up for a new accelerator program; and many more opportunities.
-

"It’s just cool that a Texas-based AI and robotics company can help a Texas-based burrito company expand in ways we could only imagine just a few years ago," says Alex Eagle, Chief Executive Officer for Freebirds World Burrito.
-

The Women of Innovation Summit will take place on Aug. 4 at Southern Methodist University’s McFarlin Auditorium during Dallas Startup Week, powered by Capital One. Women are encouraged to bring their whole work teams and even friends to make the most of a day of growth and development.