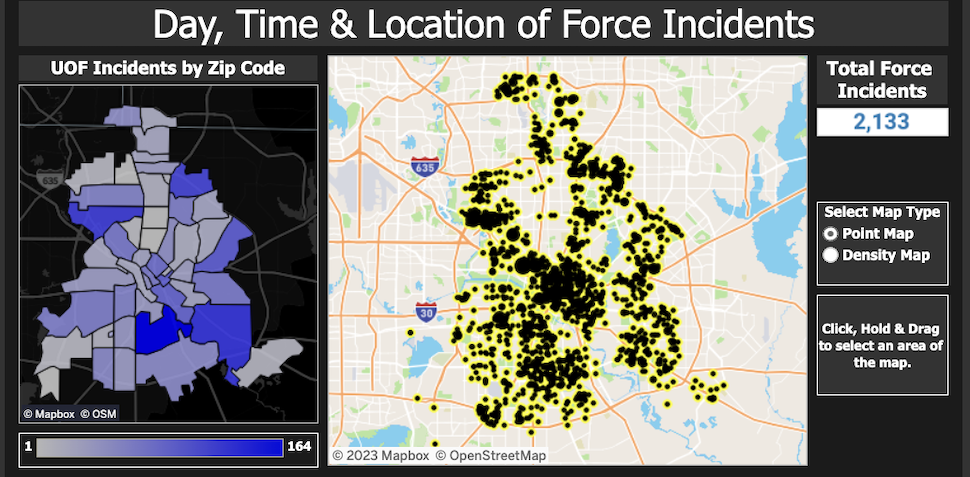
In a move to enhance public trust, the Dallas Police Department is putting its data on use-of-force incidents right on its website, with interactive dashboards that the public can use to look up incidents as far back as 2014.
The department contracted with Washington State-based Police Strategies LLC to analyze data on when its officers use force, and make it available in two both written reports and interactive dashboards.
The first written report analyzed historical data from 2014 to 2021, and offers an in-depth analysis of use-of-force data from January 1, 2021, through December 31, 2021, which can be viewed by going here.
Interactive dashboards detail tactics, restraints, injury rates, and more

Dallas Police Department use-of-force interactive dashboard image. [Source: Dallas Police Department]
The interactive dashboards, which can be viewed here, include data on the day, time, and location of force incidents; subject characteristics and crimes charged; and use-of-force tactics, restraints, and injury rates.
The dashboards feature maps, charts, and graphs to present Use-of-Force data in a format that can be filtered by single or multiple data fields.
DPD Police Chief brought program from his former post in California
Dallas Police Chief Eddie Garcia told WBAP/KLIF that he brought the use-of-force data program with him from San Jose, California, where he served as police chief from 2016 to 2021.
“It was incredibly effective in San Jose,” Garcia told WBAP/KLIF. “From it we did trainings that we saw better results for every year that we did it. That’s why it’s so important that this is not just transparency tools—[it’s] for the department to learn and study for themselves.”
![]()
Get on the list.
Dallas Innovates, every day.
Sign up to keep your eye on what’s new and next in Dallas-Fort Worth, every day.


