The state of Texas has launched the TexStats Regional Data Dashboard, an online database that gives Texans easier access to data that tracks progress at both the regional and state levels.
Acting Comptroller Kelly Hancock recently unveiled the interactive tool, which provides a clear look at trends in population, demographics, education, healthcare access, trade, infrastructure, the economy, jobs, and industry.
Hancock, a Fort Worth native and former State Senator for District 91 in Northeast Tarrant County, was appointed acting comptroller by Gov. Greg Abbott and is running for Texas comptroller in the 2026 election. The former comptroller, Glen Hegar, resigned last July to become Chancellor of the Texas A&M System.
Hancock announced the dashboard’s launch in Tyler, emphasizing the importance of data transparency so local government leaders and everyday citizens can plan and make decisions for their communities and businesses.
“In a state as big as Texas, it’s important to understand not only the big picture but also the unique regional economies, people and industries that drive our success,” Hancock said in a statement. “This new interactive tool makes that possible by letting Texans filter, download and customize data to meet their specific needs.”
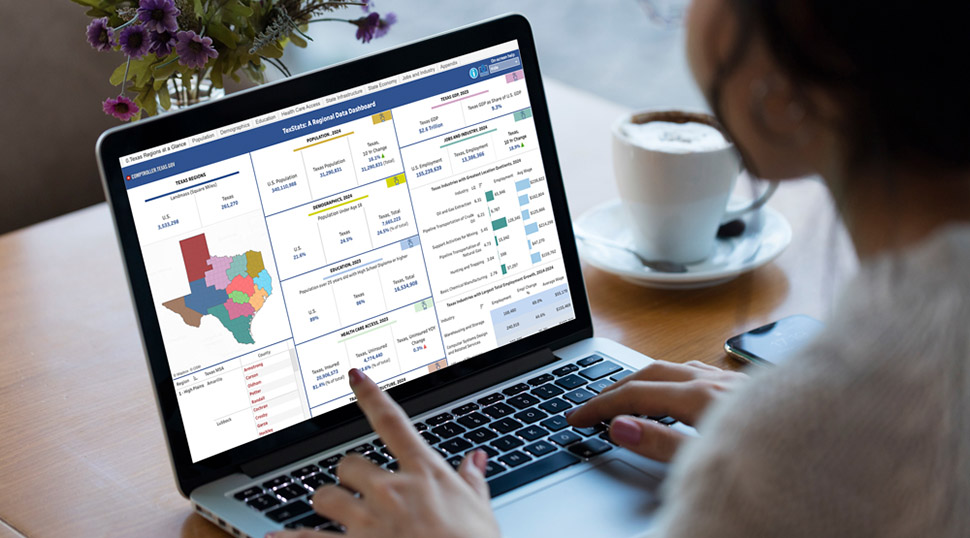
What you’ll see on TexStats
When a user visits the dashboard, they first get a broad overview of the state. They can then access different tabs across the top of the dashboard to explore the data further in a variety of topics:
- Population
- Demographics
- Education
- Health Care Access
- Trade & Infrastructure
- Economy
- Jobs & Industry
Within each tab, the information can be filtered to view statewide data, regional data, or a combination. Users can view data for all 12 of the state’s Comptroller-designated economic regions, which include at least one Census-defined metropolitan statistical area.
For example, business leaders evaluating new markets could explore the tool’s Demographics tab to learn more about the potential customer base of a region. Or they could study the Economy tab to learn about a region’s economic health.
A TexStats dashboard user would learn that the Tyler MSA has seen a 19% increase in real GDP since 2017, a higher increase than the nation. And the Upper East region, where Tyler is located, has had significant domestic migration, adding roughly 56,000 new residents to the total population since 2020.
AllianceTexas
In Fort Worth, Hancock visited AllianceTexas, the primary port of entry for the southwestern United States, where global goods are shipped directly from the ports of Los Angeles, Long Beach, and Houston via intermodal rail containers.
AllianceTexas, one of two intermodal ports in the state, facilitated $788.1 million in exports and $46.6 million in imports in 2024. Trade and related economic activity at the port contributes an estimated $16.3 billion in GDP to the Texas economy and more than 136,000 direct and indirect jobs.
In the Metroplex region, where Fort Worth is located, approximately $63.4 billion in goods were imported and exported in 2024—as found in the Trade & Infrastructure tab of the TexStats dashboard.
Port of Corpus Christi
At another port of entry, the Port of Corpus Christi, the numbers show that the port accounts for 21% of the state’s seaport trade, or $88.6 billion, and more than 864,000 direct and indirect jobs. Trade through the Port of Corpus Christi is trending up, with a 487% increase between 2016 and 2024.
“Port of Corpus Christi is a prime example of how innovation and infrastructure come together to strengthen our economy, support thousands of good jobs and keep Texas competitive on the global stage,” Hancock said during a recent visit to the port.
The TexStats dashboard’s Trade & Infrastructure tab shows the full trade dollars of Texas’ ports of entry by region. For example, in the South Texas region, where the Port of Corpus Christi is located, $548.8 billion in goods were imported and exported in 2024, the highest value in the state.
West Texas mega data center
In Texas’ Northwest region, the flagship location of the Stargate data center project — part of a $500 billion initiative by OpenAI and Oracle to build AI infrastructure across the country — is open and under expansion. The Abilene campus is on 1,100 acres, and when complete, it will include eight buildings comprising up to 4 million square feet.
During construction, reports indicate that there are more than 6,000 construction workers on site daily, while the completed data center expansion is slated to employ nearly 1,700. According to the Development Corporation of Abilene, the project’s first two buildings are expected to generate approximately $1 billion in direct and indirect economic impact to the city over the next 20 years.
Population data in the TexStats dashboard show that Abilene over the past decade has seen a 9.4% increase in population, which could trend higher in the next few years with the Stargate project.
The Economy tab of the dashboard also shows that since 2021, changes in real GDP for Abilene have been consistently outpacing U.S. economic growth.
Spotlighting small business activity
Small businesses have sizable economic impact, both regionally and statewide: Across Texas, small businesses employ about 44% of the workforce, 5.1 million people.
“Whether it’s a family-owned shop on Main Street or a fast-growing startup, small businesses power our state’s economic engine, create opportunity and strengthen the character of every Texas community,” Hancock said.
Hancock met with local leaders and business owners at the Lindale Area Chamber of Commerce to highlight the impact of small towns and small businesses.
In the Upper East region of Texas, where Lindale is located, 97.9% of all businesses are small businesses, and the restaurant industry, as shown in the Jobs & Industry tab of the TexStats dashboard, was the largest employer, with 37,998 workers in 2024.
Data access for all
The TexStats dashboard was produced by the Comptroller’s Data Analysis and Transparency Division and the Information Technology Division, using data from federal and state government agencies. The tool is updated when new information becomes available.
“With the dashboard, we’re raising the level of data transparency,” division director Will Counihan says. “The Comptroller’s office has periodically released different versions of these data in both printed and online reports. But now, the public will be able to access them at any time and be assured they have the latest data available.”
Find more information on TexStats, including access to the data, here.
Don’t miss what’s next. Subscribe to Dallas Innovates.
Track Dallas-Fort Worth’s business and innovation landscape with our curated news in your inbox Tuesday-Thursday.
R E A D N E X T
-

A new satellite campus is adding hands-on training, lab capacity and startup support to Dallas’ growing life sciences ecosystem.
-

The pilot will test Last Energy’s 5-megawatt PWR-5 design at Texas A&M–RELLIS while the company advances a plan for 30 commercial microreactors in Haskell County northwest of Dallas-Fort Worth to serve data center growth.
-

Cait Brumme says the event at Dallas' Pegasus Park on Nov. 6 will explore the technologies and economic forces defining the future for entrepreneurs and innovators.
-

The new center at Bridge Labs will train the workforce powering North Texas’ biotech boom—helping startups speed therapies, vaccines, and breakthrough biologics from lab bench to patients. Funded in part by Lyda Hill Philanthropies, the National Center for Therapeutics Manufacturing Satellite Campus is set to open this summer.
-

The grant supports development of reusable, impact-resistant materials designed to withstand frequent landings and collision events in next-generation aircraft—everything from air taxis to the flying cars of the future.